| Param | Original file | Final file |
|---|---|---|
| Filename | modeM0/AS1T02_012T02_9000001948cztM0_level2_bc.evt | modeM0/AS1T02_012T02_9000001948cztM0_level2_quad_clean.evt |
| Size (bytes) | 200,226,240 | 55,834,560 |
| Size | 191.0 MB | 53.2 MB |
| Events in quadrant A | 1,380,937 | 348,081 |
| Events in quadrant B | 1,450,305 | 337,124 |
| Events in quadrant C | 903,566 | 345,548 |
| Events in quadrant D | 1,995,879 | 324,354 |
| Mode SS | |||
|---|---|---|---|
| Quadrant | BADHDUFLAG | Total packets | Discarded packets |
| A | 0 | 98 | 0 |
| B | 0 | 98 | 0 |
| C | 0 | 98 | 0 |
| D | 0 | 98 | 0 |
| Mode M0 | |||
|---|---|---|---|
| Quadrant | BADHDUFLAG | Total packets | Discarded packets |
| A | 0 | 11165 | 0 |
| B | 0 | 11785 | 0 |
| C | 0 | 9717 | 0 |
| D | 0 | 13580 | 0 |
| Mode M9 | |||
|---|---|---|---|
| Quadrant | BADHDUFLAG | Total packets | Discarded packets |
| A | 0 | 7 | 0 |
| B | 0 | 7 | 0 |
| C | 0 | 7 | 0 |
| D | 0 | 7 | 0 |
| Quadrant | Total seconds | Saturated seconds | Saturation percentage |
|---|---|---|---|
| A | 4772 | 50 | 1.047779% |
| B | 4772 | 274 | 5.741827% |
| C | 4772 | 24 | 0.502934% |
| D | 4772 | 323 | 6.768650% |
Noise dominated data is calculated using 1-second bins in cleaned event files. If a bin has >2000 counts, and if more than 50% of those come from <1% of pixels, then it is considered to be noise-dominated and hence unusable.
| Quadrant | # 1 sec bins | Bins with >0 counts | Bins with >2000 counts | High rate bins dominated by noise | Noise dominated (total time) | Noise dominated (detector-on time) | Marked lightcurve |
|---|---|---|---|---|---|---|---|
| A | 5508 | 4773 | 0 | 0 | 0.00% | 0.00% | 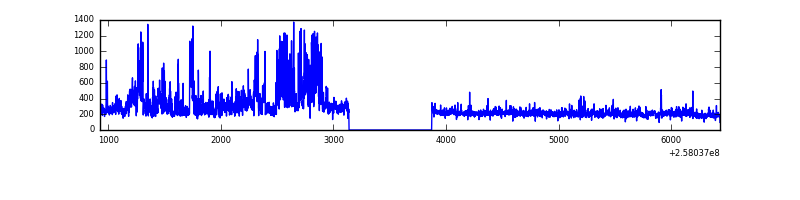 |
| B | 5508 | 4773 | 58 | 58 | 1.05% | 1.22% |  |
| C | 5508 | 4773 | 0 | 0 | 0.00% | 0.00% |  |
| D | 5508 | 4773 | 65 | 65 | 1.18% | 1.36% |  |
Top three noisy pixels from each quadrant. If the there are fewer than three noisy pixels in the level2.evt file, extra rows are filled as -1
| Pixel properties | Quadrant properties | ||||||
|---|---|---|---|---|---|---|---|
| Quadrant | DetID | PixID | Counts | Sigma | Mean | Median | Sigma |
| A | 0 | 23 | 209420 | 3924.64 | 230 | 224 | 53.3 |
| A | 12 | 189 | 192433 | 3605.95 | 230 | 224 | 53.3 |
| A | 15 | 222 | 32523 | 605.95 | 230 | 224 | 53.3 |
| B | 4 | 239 | 480405 | 10274.4 | 226 | 220 | 46.7 |
| B | 3 | 64 | 23893 | 506.53 | 226 | 220 | 46.7 |
| B | 3 | 209 | 14821 | 312.41 | 226 | 220 | 46.7 |
| C | 15 | 208 | 13018 | 242.17 | 226 | 222 | 52.8 |
| C | 12 | 4 | 2513 | 43.36 | 226 | 222 | 52.8 |
| C | 14 | 234 | 1392 | 22.14 | 226 | 222 | 52.8 |
| D | 1 | 52 | 661140 | 12172.8 | 222 | 213 | 54.3 |
| D | 1 | 7 | 245662 | 4520.62 | 222 | 213 | 54.3 |
| D | 10 | 157 | 121558 | 2234.9 | 222 | 213 | 54.3 |
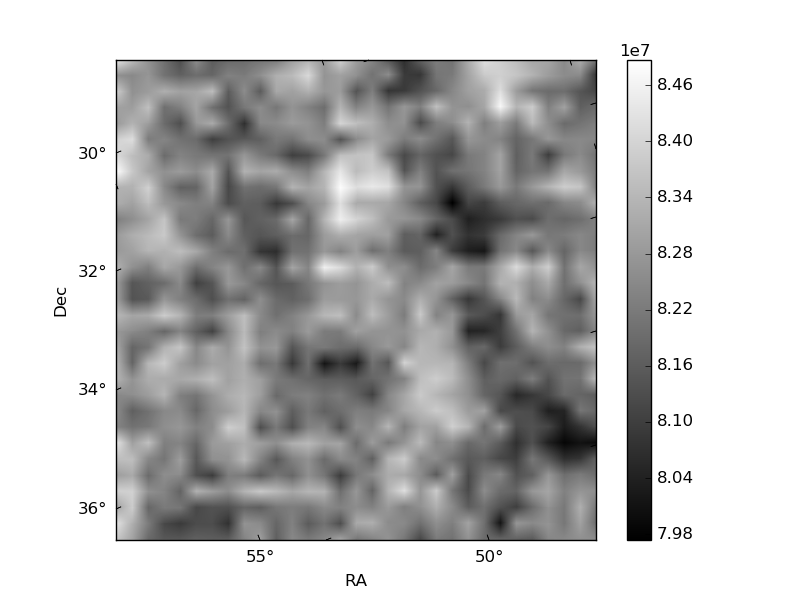
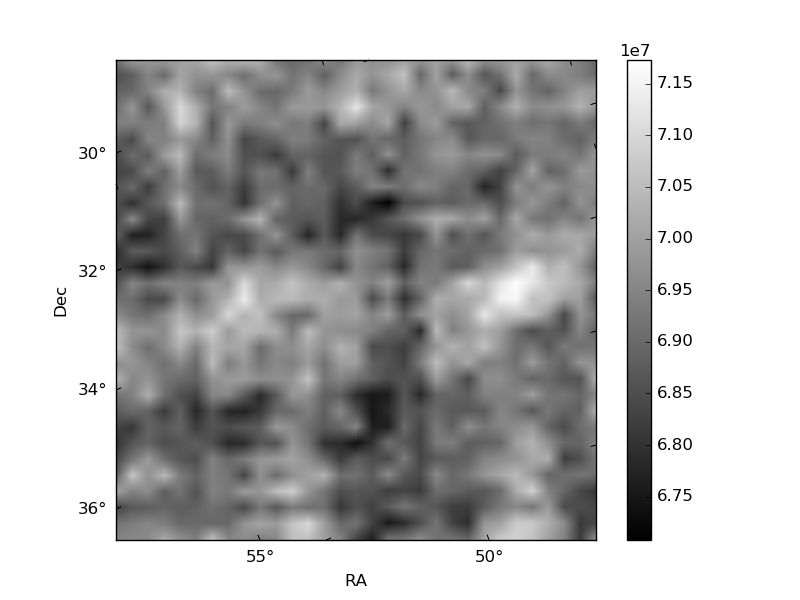
Histogram calculated using DETX and DETY for each event in the final _common_clean file
| Quadrant A | 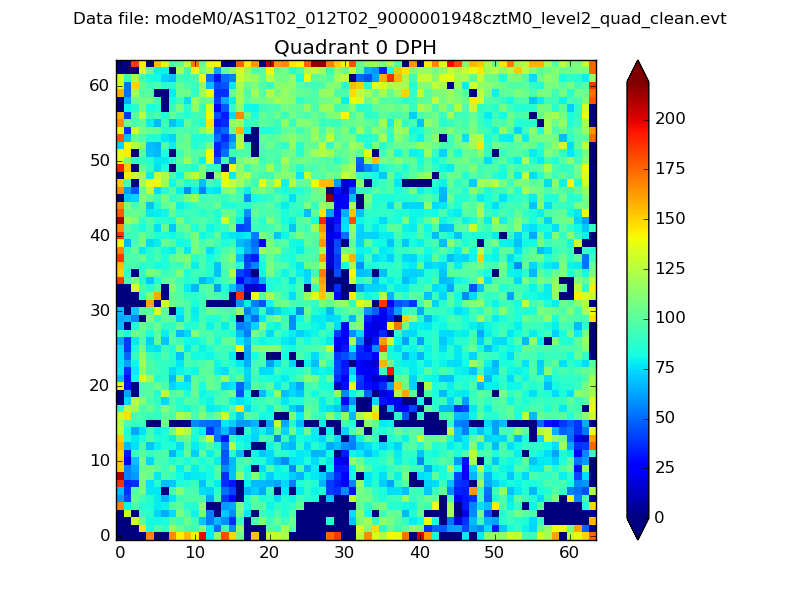 |
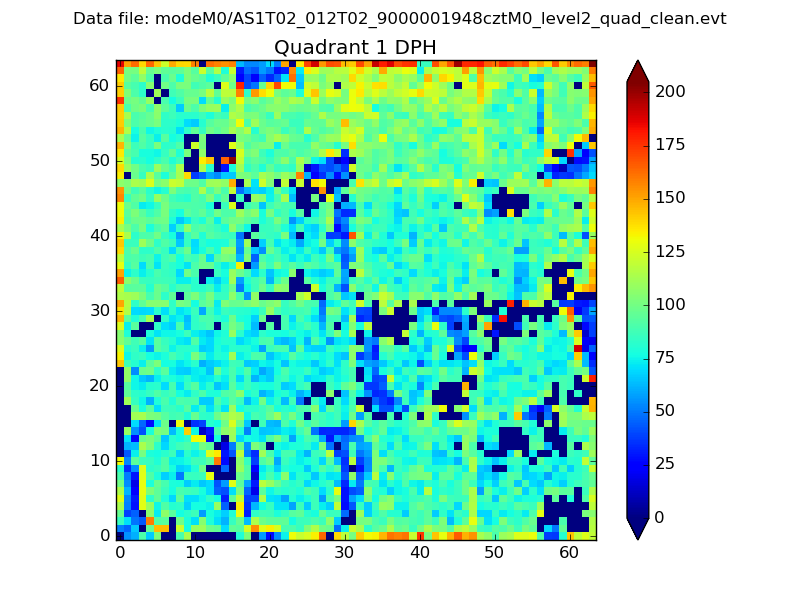 |
Quadrant B |
|---|---|---|---|
| Quadrant D |  |
 |
Quadrant C |
| Plot type | Count rate plots | Images |
|---|---|---|
| Comparison with Poisson distribution Blue bars denote a histogram of data divided into 1 sec bins. Red curve is a Poisson curve with rate = median count rate of data. |
 |
 |
| Quadrant-wise count rates Data is divided into 100 sec bins |
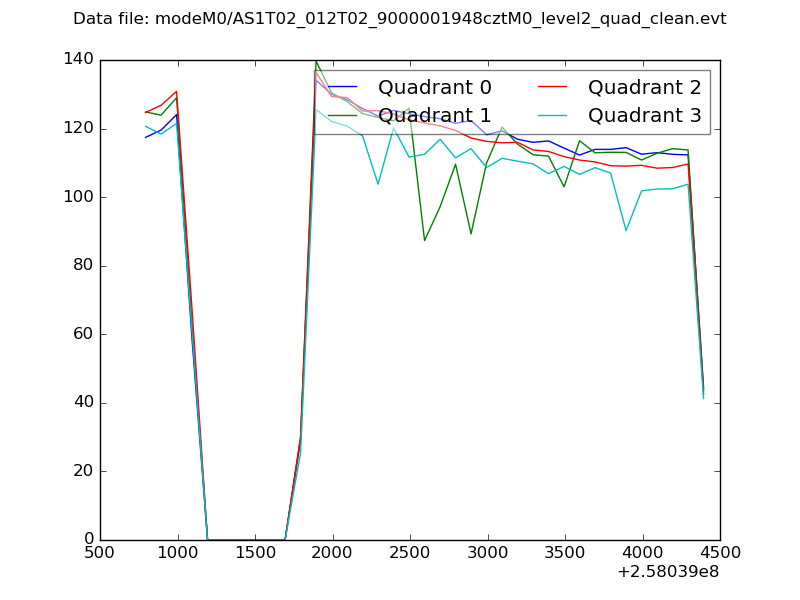 |
|
| Module-wise count rates for Quadrant A Data is divided into 100 sec bins |
 |
 |
| Module-wise count rates for Quadrant B Data is divided into 100 sec bins |
 |
 |
| Module-wise count rates for Quadrant C Data is divided into 100 sec bins |
 |
 |
| Module-wise count rates for Quadrant D Data is divided into 100 sec bins |
 |
 |
| Parameter | Plot |
|---|---|
| CZT HV Monitor |  |
| D_VDD | 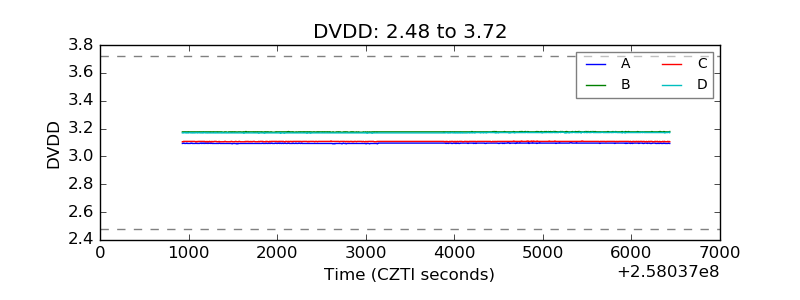 |
| Temperature 1 |  |
| Veto HV Monitor |  |
| Veto LLD | 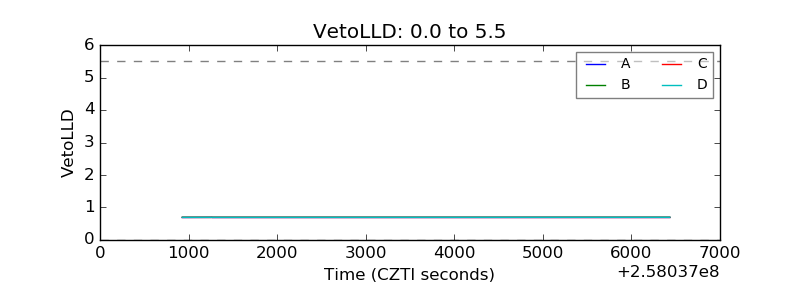 |
| Alpha Counter |  |
| _CPM_Rate | 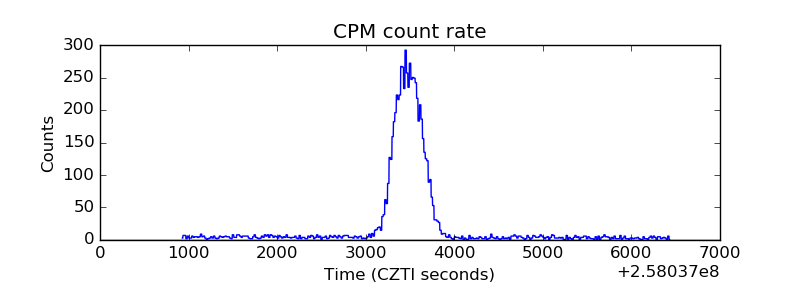 |
| CZT Counter |  |
| +2.5 Volts monitor | 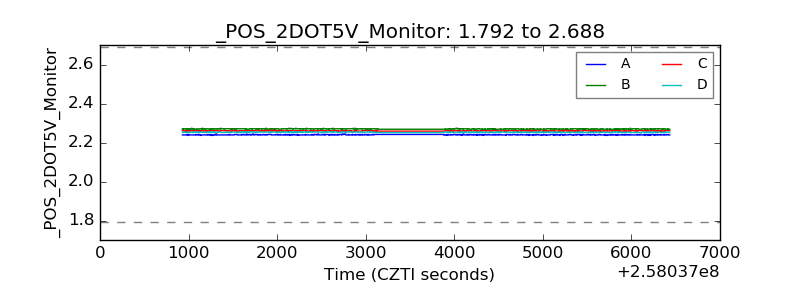 |
| +5 Volts monitor |  |
| _ROLL_ROT |  |
| _Roll_DEC |  |
| _Roll_RA |  |
| Veto Counter |  |