| Param | Original file | Final file |
|---|---|---|
| Filename | modeM0/AS1T02_012T01_9000001946cztM0_level2_bc.evt | modeM0/AS1T02_012T01_9000001946cztM0_level2_quad_clean.evt |
| Size (bytes) | 200,183,040 | 56,350,080 |
| Size | 190.9 MB | 53.7 MB |
| Events in quadrant A | 1,815,167 | 355,798 |
| Events in quadrant B | 1,525,544 | 347,950 |
| Events in quadrant C | 778,660 | 363,736 |
| Events in quadrant D | 1,648,899 | 342,158 |
| Mode SS | |||
|---|---|---|---|
| Quadrant | BADHDUFLAG | Total packets | Discarded packets |
| A | 0 | 88 | 0 |
| B | 0 | 88 | 0 |
| C | 0 | 88 | 0 |
| D | 0 | 88 | 0 |
| Mode M0 | |||
|---|---|---|---|
| Quadrant | BADHDUFLAG | Total packets | Discarded packets |
| A | 0 | 12402 | 0 |
| B | 0 | 11333 | 0 |
| C | 0 | 8585 | 0 |
| D | 0 | 11693 | 0 |
| Mode M9 | |||
|---|---|---|---|
| Quadrant | BADHDUFLAG | Total packets | Discarded packets |
| A | 0 | 5 | 0 |
| B | 0 | 5 | 0 |
| C | 0 | 5 | 0 |
| D | 0 | 5 | 0 |
| Quadrant | Total seconds | Saturated seconds | Saturation percentage |
|---|---|---|---|
| A | 4199 | 222 | 5.286973% |
| B | 4199 | 368 | 8.763991% |
| C | 4199 | 35 | 0.833532% |
| D | 4199 | 247 | 5.882353% |
Noise dominated data is calculated using 1-second bins in cleaned event files. If a bin has >2000 counts, and if more than 50% of those come from <1% of pixels, then it is considered to be noise-dominated and hence unusable.
| Quadrant | # 1 sec bins | Bins with >0 counts | Bins with >2000 counts | High rate bins dominated by noise | Noise dominated (total time) | Noise dominated (detector-on time) | Marked lightcurve |
|---|---|---|---|---|---|---|---|
| A | 4750 | 4200 | 12 | 12 | 0.25% | 0.29% |  |
| B | 4750 | 4198 | 78 | 78 | 1.64% | 1.86% | 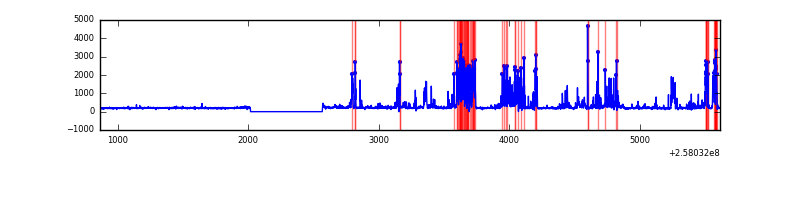 |
| C | 4750 | 4200 | 0 | 0 | 0.00% | 0.00% |  |
| D | 4750 | 4199 | 21 | 21 | 0.44% | 0.50% |  |
Top three noisy pixels from each quadrant. If the there are fewer than three noisy pixels in the level2.evt file, extra rows are filled as -1
| Pixel properties | Quadrant properties | ||||||
|---|---|---|---|---|---|---|---|
| Quadrant | DetID | PixID | Counts | Sigma | Mean | Median | Sigma |
| A | 12 | 189 | 885930 | 18903.04 | 198 | 193 | 46.9 |
| A | 12 | 173 | 69121 | 1471.03 | 198 | 193 | 46.9 |
| A | 0 | 23 | 42559 | 904.16 | 198 | 193 | 46.9 |
| B | 4 | 239 | 619494 | 15189.07 | 196 | 190 | 40.8 |
| B | 3 | 64 | 49458 | 1208.35 | 196 | 190 | 40.8 |
| B | 0 | 189 | 42223 | 1030.9 | 196 | 190 | 40.8 |
| C | 13 | 61 | 1220 | 21.99 | 198 | 195 | 46.6 |
| C | 8 | 222 | 1179 | 21.11 | 198 | 195 | 46.6 |
| C | 14 | 234 | 822 | 13.45 | 198 | 195 | 46.6 |
| D | 1 | 52 | 598230 | 12790.67 | 195 | 187 | 46.8 |
| D | 13 | 122 | 100639 | 2148.42 | 195 | 187 | 46.8 |
| D | 5 | 222 | 68391 | 1458.72 | 195 | 187 | 46.8 |
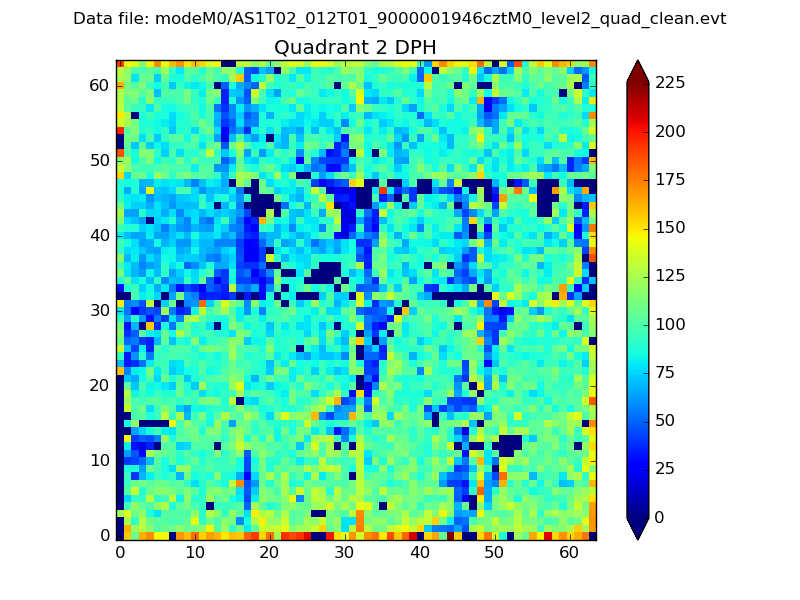
Histogram calculated using DETX and DETY for each event in the final _common_clean file
| Quadrant A |  |
 |
Quadrant B |
|---|---|---|---|
| Quadrant D |  |
 |
Quadrant C |
| Plot type | Count rate plots | Images |
|---|---|---|
| Comparison with Poisson distribution Blue bars denote a histogram of data divided into 1 sec bins. Red curve is a Poisson curve with rate = median count rate of data. |
 |
 |
| Quadrant-wise count rates Data is divided into 100 sec bins |
 |
|
| Module-wise count rates for Quadrant A Data is divided into 100 sec bins |
 |
 |
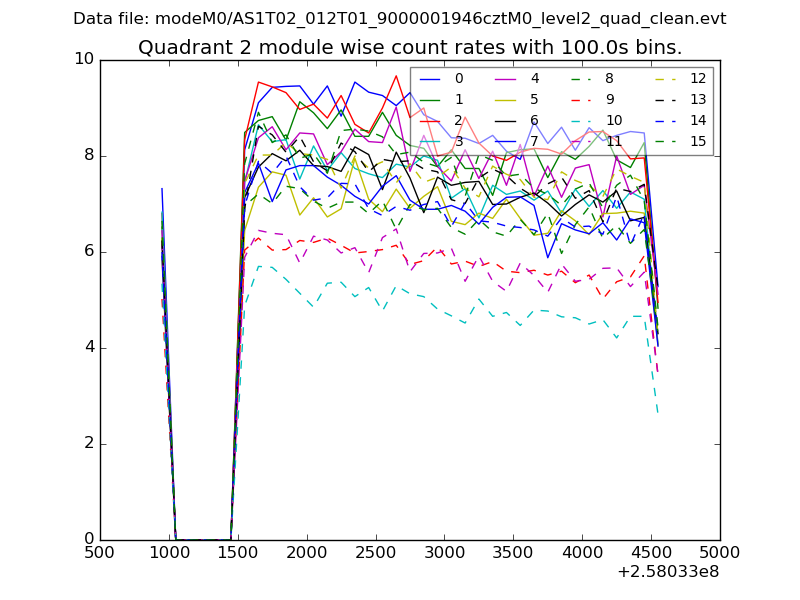
| Module-wise count rates for Quadrant B Data is divided into 100 sec bins |
 |
 |
| Module-wise count rates for Quadrant C Data is divided into 100 sec bins |
 |
 |
| Module-wise count rates for Quadrant D Data is divided into 100 sec bins |
 |
 |
| Parameter | Plot |
|---|---|
| CZT HV Monitor | 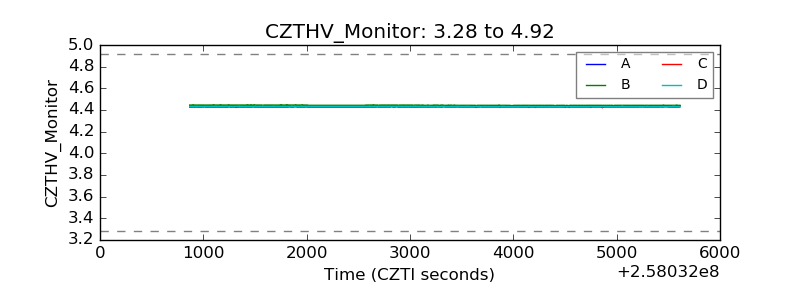 |
| D_VDD | 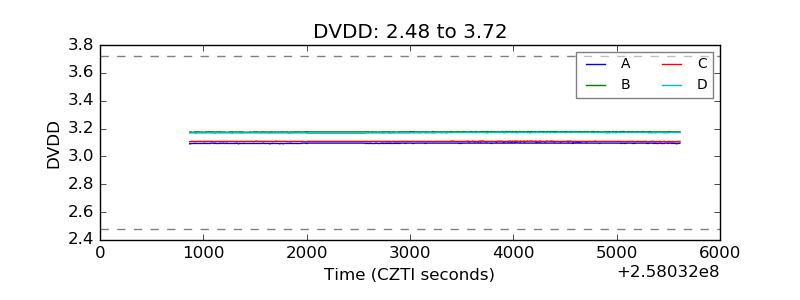 |
| Temperature 1 | 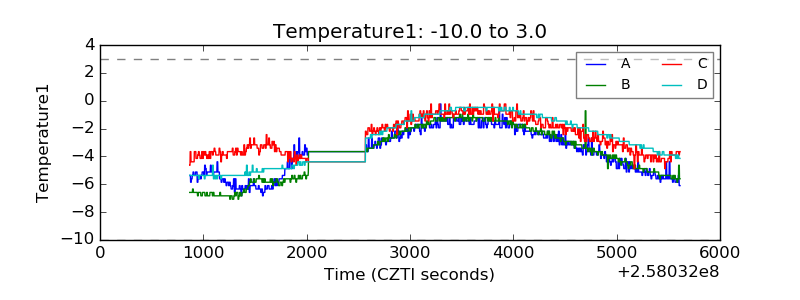 |
| Veto HV Monitor |  |
| Veto LLD |  |
| Alpha Counter |  |
| _CPM_Rate |  |
| CZT Counter |  |
| +2.5 Volts monitor |  |
| +5 Volts monitor | 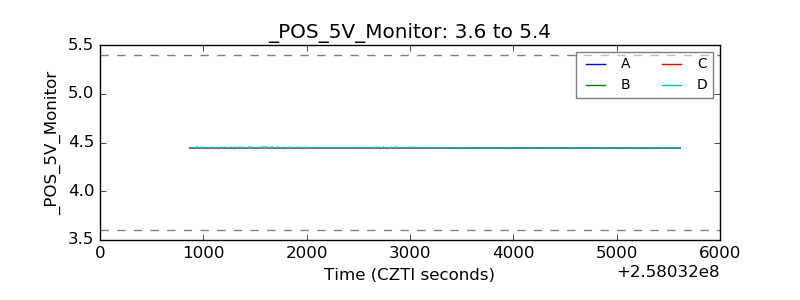 |
| _ROLL_ROT |  |
| _Roll_DEC |  |
| _Roll_RA | 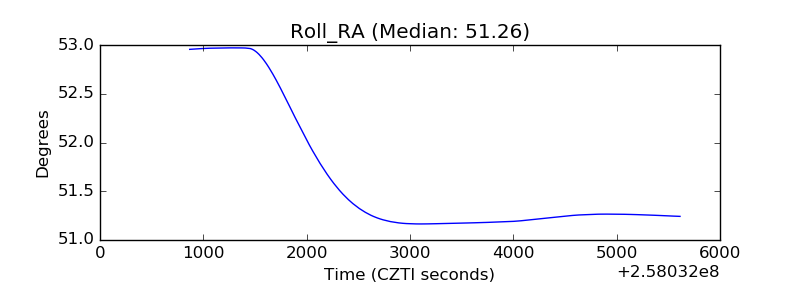 |
| Veto Counter | 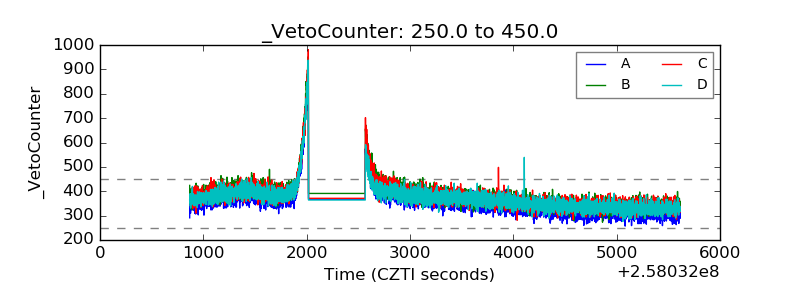 |