| Param | Original file | Final file |
|---|---|---|
| Filename | modeM0/AS1A04_094T01_9000001942cztM0_level2_bc.evt | modeM0/AS1A04_094T01_9000001942cztM0_level2_quad_clean.evt |
| Size (bytes) | 3,694,898,880 | 1,304,625,600 |
| Size | 3.4 GB | 1.2 GB |
| Events in quadrant A | 23,175,029 | 8,212,827 |
| Events in quadrant B | 31,991,965 | 8,187,442 |
| Events in quadrant C | 19,405,180 | 8,427,447 |
| Events in quadrant D | 30,583,904 | 7,904,624 |
| Mode SS | |||
|---|---|---|---|
| Quadrant | BADHDUFLAG | Total packets | Discarded packets |
| A | 0 | 2016 | 0 |
| B | 0 | 2016 | 0 |
| C | 0 | 2016 | 0 |
| D | 0 | 2016 | 0 |
| Mode M0 | |||
|---|---|---|---|
| Quadrant | BADHDUFLAG | Total packets | Discarded packets |
| A | 0 | 212243 | 0 |
| B | 0 | 256628 | 0 |
| C | 0 | 203338 | 0 |
| D | 0 | 241376 | 0 |
| Mode M9 | |||
|---|---|---|---|
| Quadrant | BADHDUFLAG | Total packets | Discarded packets |
| A | 0 | 164 | 0 |
| B | 0 | 164 | 0 |
| C | 0 | 164 | 0 |
| D | 0 | 164 | 0 |
| Quadrant | Total seconds | Saturated seconds | Saturation percentage |
|---|---|---|---|
| A | 98970 | 1376 | 1.390320% |
| B | 98972 | 7674 | 7.753708% |
| C | 98978 | 993 | 1.003253% |
| D | 98969 | 3930 | 3.970940% |
Noise dominated data is calculated using 1-second bins in cleaned event files. If a bin has >2000 counts, and if more than 50% of those come from <1% of pixels, then it is considered to be noise-dominated and hence unusable.
| Quadrant | # 1 sec bins | Bins with >0 counts | Bins with >2000 counts | High rate bins dominated by noise | Noise dominated (total time) | Noise dominated (detector-on time) | Marked lightcurve |
|---|---|---|---|---|---|---|---|
| A | 115330 | 98984 | 32 | 32 | 0.03% | 0.03% | 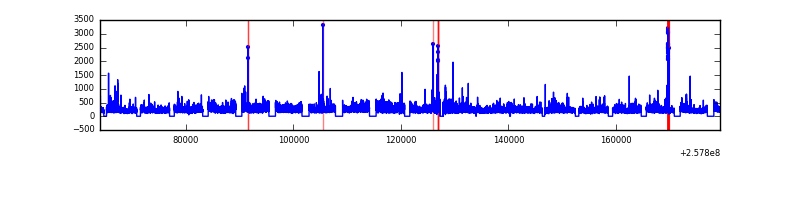 |
| B | 115330 | 98816 | 1125 | 1125 | 0.98% | 1.14% |  |
| C | 115330 | 98982 | 3 | 3 | 0.00% | 0.00% |  |
| D | 115330 | 98973 | 621 | 621 | 0.54% | 0.63% |  |
Top three noisy pixels from each quadrant. If the there are fewer than three noisy pixels in the level2.evt file, extra rows are filled as -1
| Pixel properties | Quadrant properties | ||||||
|---|---|---|---|---|---|---|---|
| Quadrant | DetID | PixID | Counts | Sigma | Mean | Median | Sigma |
| A | 12 | 189 | 1901154 | 1772.6 | 4925 | 4830 | 1069.8 |
| A | 0 | 23 | 1134048 | 1055.54 | 4925 | 4830 | 1069.8 |
| A | 8 | 192 | 311629 | 286.78 | 4925 | 4830 | 1069.8 |
| B | 4 | 239 | 9991516 | 11057.56 | 4810 | 4678 | 903.2 |
| B | 3 | 64 | 1691119 | 1867.25 | 4810 | 4678 | 903.2 |
| B | 4 | 80 | 344350 | 376.09 | 4810 | 4678 | 903.2 |
| C | 15 | 208 | 120838 | 108.2 | 4902 | 4836 | 1072.1 |
| C | 14 | 234 | 47581 | 39.87 | 4902 | 4836 | 1072.1 |
| C | 0 | 207 | 34117 | 27.31 | 4902 | 4836 | 1072.1 |
| D | 1 | 52 | 7679897 | 6920.95 | 4819 | 4648 | 1109.0 |
| D | 8 | 195 | 1442540 | 1296.58 | 4819 | 4648 | 1109.0 |
| D | 10 | 157 | 1342064 | 1205.98 | 4819 | 4648 | 1109.0 |
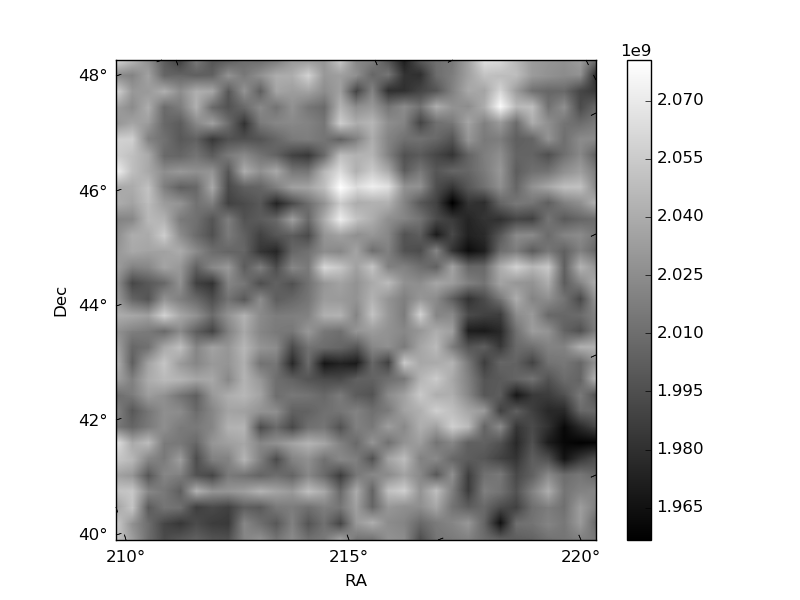
Histogram calculated using DETX and DETY for each event in the final _common_clean file
| Quadrant A |  |
 |
Quadrant B |
|---|---|---|---|
| Quadrant D |  |
 |
Quadrant C |
| Plot type | Count rate plots | Images |
|---|---|---|
| Comparison with Poisson distribution Blue bars denote a histogram of data divided into 1 sec bins. Red curve is a Poisson curve with rate = median count rate of data. |
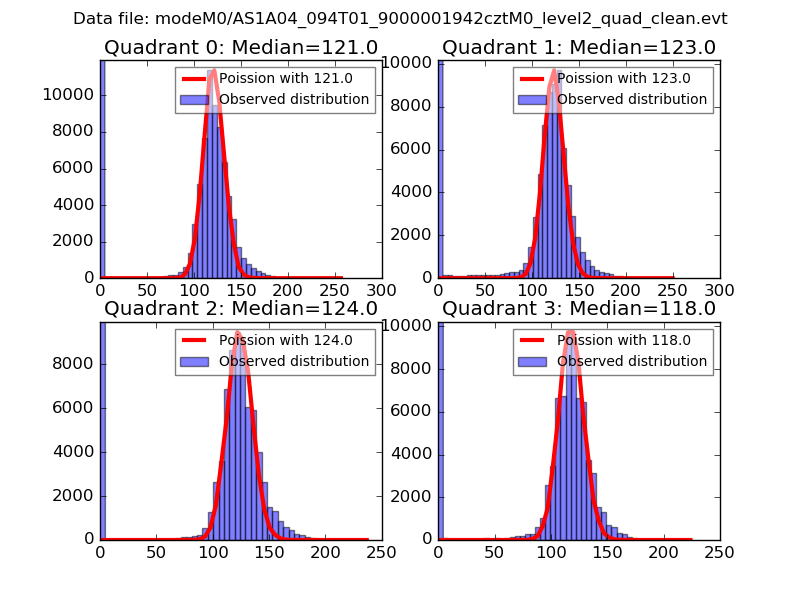 |
 |
| Quadrant-wise count rates Data is divided into 100 sec bins |
 |
|
| Module-wise count rates for Quadrant A Data is divided into 100 sec bins |
 |
 |
| Module-wise count rates for Quadrant B Data is divided into 100 sec bins |
 |
 |
| Module-wise count rates for Quadrant C Data is divided into 100 sec bins |
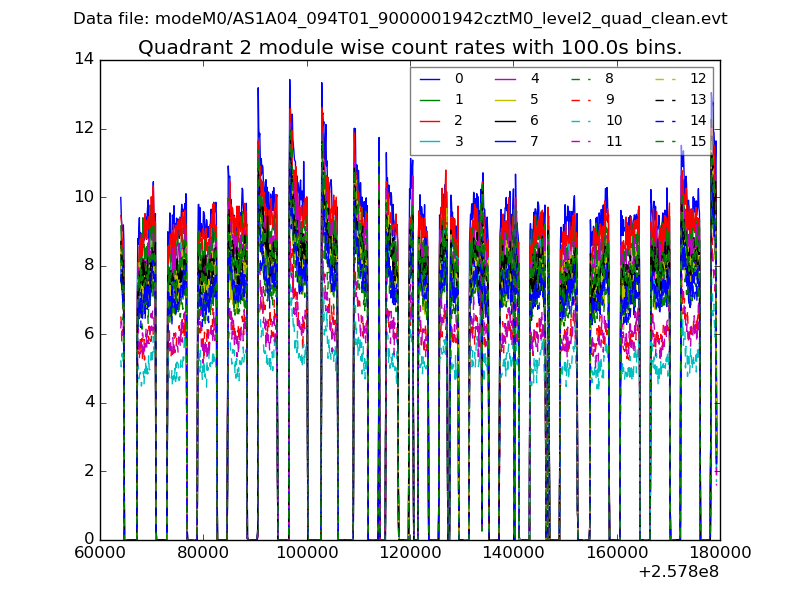 |
 |
| Module-wise count rates for Quadrant D Data is divided into 100 sec bins |
 |
 |
| Parameter | Plot |
|---|---|
| CZT HV Monitor | 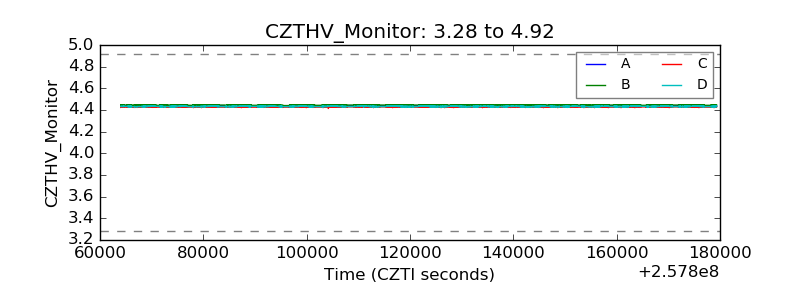 |
| D_VDD |  |
| Temperature 1 | 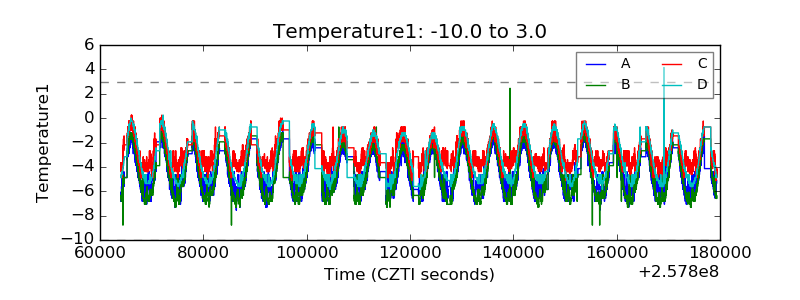 |
| Veto HV Monitor |  |
| Veto LLD | 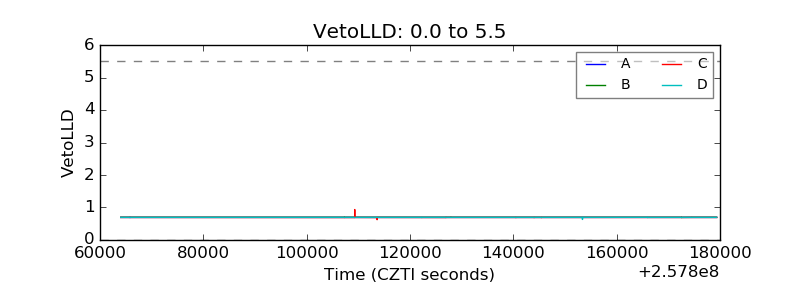 |
| Alpha Counter | 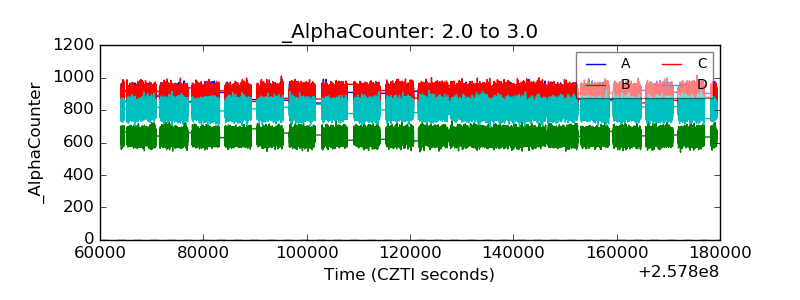 |
| _CPM_Rate |  |
| CZT Counter | 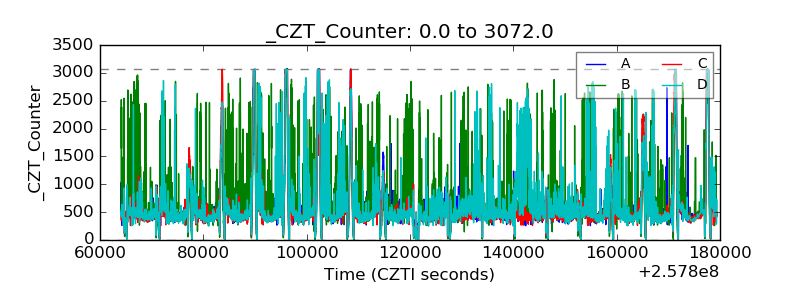 |
| +2.5 Volts monitor |  |
| +5 Volts monitor |  |
| _ROLL_ROT |  |
| _Roll_DEC | 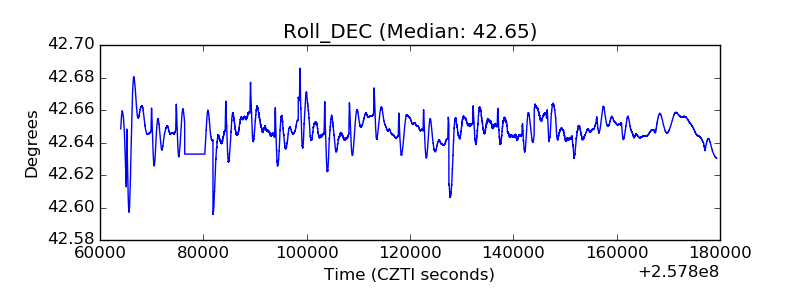 |
| _Roll_RA |  |
| Veto Counter |  |