| Param | Original file | Final file |
|---|---|---|
| Filename | modeM0/AS1G08_061T01_9000001938cztM0_level2_bc.evt | modeM0/AS1G08_061T01_9000001938cztM0_level2_quad_clean.evt |
| Size (bytes) | 869,342,400 | 255,202,560 |
| Size | 829.1 MB | 243.4 MB |
| Events in quadrant A | 4,502,218 | 1,616,046 |
| Events in quadrant B | 8,368,435 | 1,555,999 |
| Events in quadrant C | 3,913,577 | 1,639,448 |
| Events in quadrant D | 8,139,969 | 1,505,467 |
| Mode M0 | |||
|---|---|---|---|
| Quadrant | BADHDUFLAG | Total packets | Discarded packets |
| A | 0 | 43226 | 0 |
| B | 0 | 65011 | 0 |
| C | 0 | 41825 | 0 |
| D | 0 | 57366 | 0 |
| Mode M9 | |||
|---|---|---|---|
| Quadrant | BADHDUFLAG | Total packets | Discarded packets |
| A | 0 | 28 | 0 |
| B | 0 | 28 | 0 |
| C | 0 | 28 | 0 |
| D | 0 | 28 | 0 |
| Mode SS | |||
|---|---|---|---|
| Quadrant | BADHDUFLAG | Total packets | Discarded packets |
| A | 0 | 416 | 0 |
| B | 0 | 416 | 0 |
| C | 0 | 416 | 0 |
| D | 0 | 416 | 0 |
| Quadrant | Total seconds | Saturated seconds | Saturation percentage |
|---|---|---|---|
| A | 20495 | 256 | 1.249085% |
| B | 20495 | 3395 | 16.565016% |
| C | 20495 | 202 | 0.985606% |
| D | 20495 | 1456 | 7.104172% |
Noise dominated data is calculated using 1-second bins in cleaned event files. If a bin has >2000 counts, and if more than 50% of those come from <1% of pixels, then it is considered to be noise-dominated and hence unusable.
| Quadrant | # 1 sec bins | Bins with >0 counts | Bins with >2000 counts | High rate bins dominated by noise | Noise dominated (total time) | Noise dominated (detector-on time) | Marked lightcurve |
|---|---|---|---|---|---|---|---|
| A | 23296 | 20498 | 0 | 0 | 0.00% | 0.00% |  |
| B | 23296 | 20471 | 256 | 256 | 1.10% | 1.25% | 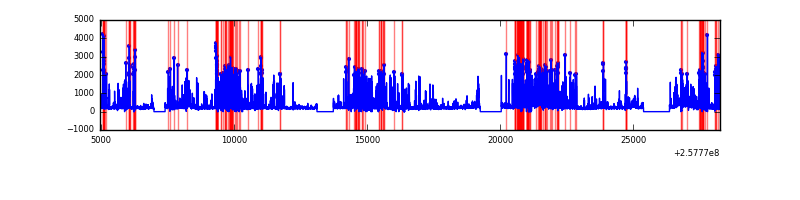 |
| C | 23296 | 20496 | 3 | 3 | 0.01% | 0.01% |  |
| D | 23296 | 20497 | 399 | 399 | 1.71% | 1.95% |  |
Top three noisy pixels from each quadrant. If the there are fewer than three noisy pixels in the level2.evt file, extra rows are filled as -1
| Pixel properties | Quadrant properties | ||||||
|---|---|---|---|---|---|---|---|
| Quadrant | DetID | PixID | Counts | Sigma | Mean | Median | Sigma |
| A | 12 | 189 | 295005 | 1304.36 | 1004 | 980 | 225.4 |
| A | 0 | 23 | 161792 | 713.4 | 1004 | 980 | 225.4 |
| A | 13 | 248 | 56788 | 247.58 | 1004 | 980 | 225.4 |
| B | 4 | 239 | 3196248 | 17971.33 | 915 | 888 | 177.8 |
| B | 0 | 85 | 1000309 | 5620.94 | 915 | 888 | 177.8 |
| B | 3 | 64 | 252767 | 1416.62 | 915 | 888 | 177.8 |
| C | 14 | 234 | 15892 | 67.31 | 992 | 975 | 221.6 |
| C | 15 | 208 | 10809 | 44.37 | 992 | 975 | 221.6 |
| C | 13 | 61 | 6039 | 22.85 | 992 | 975 | 221.6 |
| D | 1 | 52 | 3967554 | 17531.37 | 967 | 929 | 226.3 |
| D | 5 | 222 | 210769 | 927.43 | 967 | 929 | 226.3 |
| D | 2 | 234 | 101200 | 443.17 | 967 | 929 | 226.3 |
Histogram calculated using DETX and DETY for each event in the final _common_clean file
| Quadrant A | 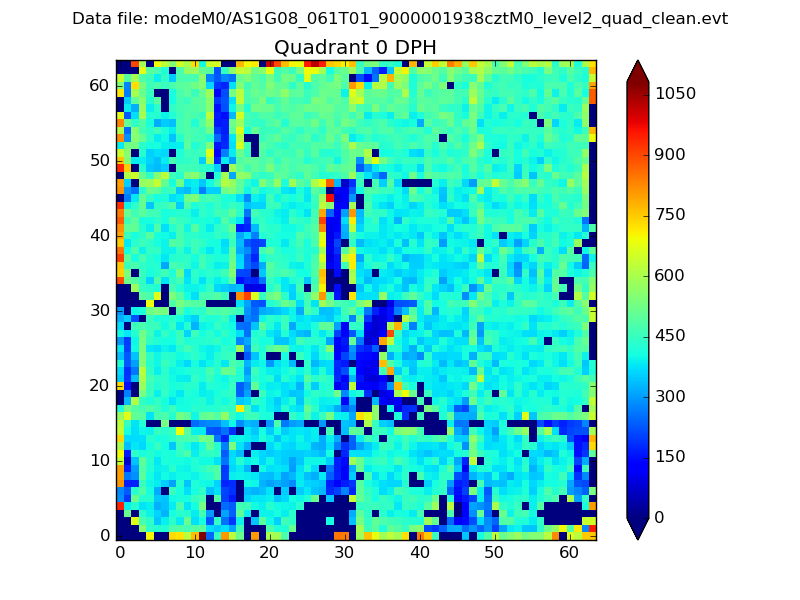 |
 |
Quadrant B |
|---|---|---|---|
| Quadrant D | 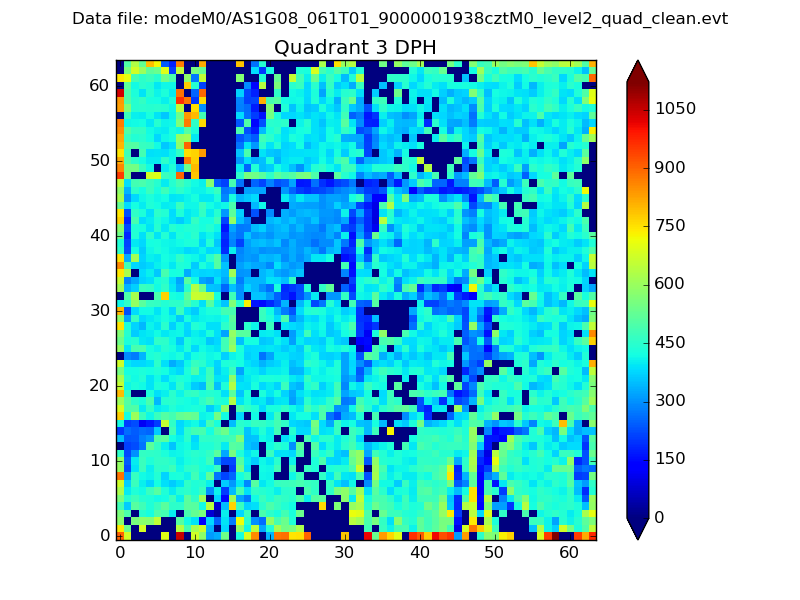 |
 |
Quadrant C |
| Plot type | Count rate plots | Images |
|---|---|---|
| Comparison with Poisson distribution Blue bars denote a histogram of data divided into 1 sec bins. Red curve is a Poisson curve with rate = median count rate of data. |
 |
 |
| Quadrant-wise count rates Data is divided into 100 sec bins |
 |
|
| Module-wise count rates for Quadrant A Data is divided into 100 sec bins |
 |
 |
| Module-wise count rates for Quadrant B Data is divided into 100 sec bins |
 |
 |
| Module-wise count rates for Quadrant C Data is divided into 100 sec bins |
 |
 |
| Module-wise count rates for Quadrant D Data is divided into 100 sec bins |
 |
 |
| Parameter | Plot |
|---|---|
| CZT HV Monitor |  |
| D_VDD |  |
| Temperature 1 |  |
| Veto HV Monitor | 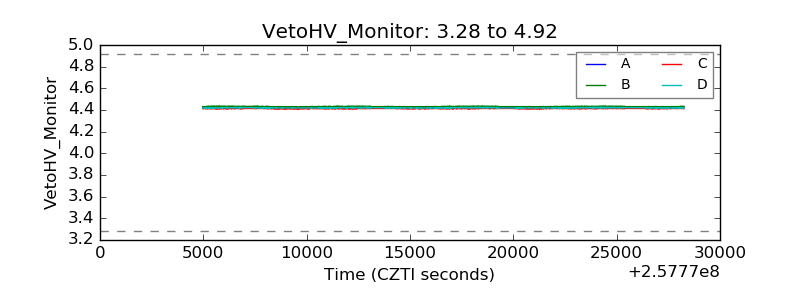 |
| Veto LLD |  |
| Alpha Counter |  |
| _CPM_Rate |  |
| CZT Counter |  |
| +2.5 Volts monitor |  |
| +5 Volts monitor |  |
| _ROLL_ROT |  |
| _Roll_DEC |  |
| _Roll_RA |  |
| Veto Counter |  |