| Param | Original file | Final file |
|---|---|---|
| Filename | modeM0/AS1A04_053T05_9000001936cztM0_level2_bc.evt | modeM0/AS1A04_053T05_9000001936cztM0_level2_quad_clean.evt |
| Size (bytes) | 360,031,680 | 140,685,120 |
| Size | 343.4 MB | 134.2 MB |
| Events in quadrant A | 2,058,611 | 916,539 |
| Events in quadrant B | 4,167,312 | 854,115 |
| Events in quadrant C | 1,793,518 | 932,531 |
| Events in quadrant D | 2,221,624 | 891,685 |
| Mode M0 | |||
|---|---|---|---|
| Quadrant | BADHDUFLAG | Total packets | Discarded packets |
| A | 0 | 20235 | 0 |
| B | 0 | 31547 | 0 |
| C | 0 | 19671 | 0 |
| D | 0 | 20671 | 0 |
| Mode SS | |||
|---|---|---|---|
| Quadrant | BADHDUFLAG | Total packets | Discarded packets |
| A | 0 | 196 | 0 |
| B | 0 | 196 | 0 |
| C | 0 | 196 | 0 |
| D | 0 | 196 | 0 |
| Mode M9 | |||
|---|---|---|---|
| Quadrant | BADHDUFLAG | Total packets | Discarded packets |
| A | 0 | 4 | 0 |
| B | 0 | 4 | 0 |
| C | 0 | 4 | 0 |
| D | 0 | 4 | 0 |
| Quadrant | Total seconds | Saturated seconds | Saturation percentage |
|---|---|---|---|
| A | 9595 | 327 | 3.408025% |
| B | 9595 | 1800 | 18.759771% |
| C | 9595 | 179 | 1.865555% |
| D | 9595 | 227 | 2.365816% |
Noise dominated data is calculated using 1-second bins in cleaned event files. If a bin has >2000 counts, and if more than 50% of those come from <1% of pixels, then it is considered to be noise-dominated and hence unusable.
| Quadrant | # 1 sec bins | Bins with >0 counts | Bins with >2000 counts | High rate bins dominated by noise | Noise dominated (total time) | Noise dominated (detector-on time) | Marked lightcurve |
|---|---|---|---|---|---|---|---|
| A | 9981 | 9597 | 2 | 2 | 0.02% | 0.02% | 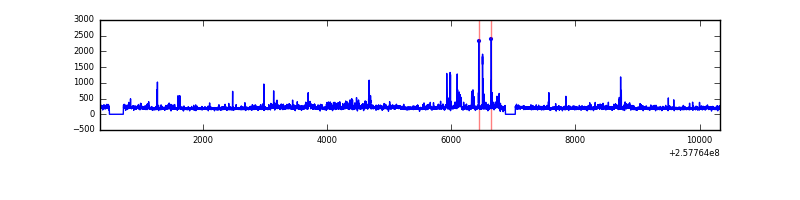 |
| B | 9981 | 9590 | 132 | 132 | 1.32% | 1.38% |  |
| C | 9981 | 9596 | 1 | 1 | 0.01% | 0.01% |  |
| D | 9981 | 9596 | 7 | 7 | 0.07% | 0.07% |  |
Top three noisy pixels from each quadrant. If the there are fewer than three noisy pixels in the level2.evt file, extra rows are filled as -1
| Pixel properties | Quadrant properties | ||||||
|---|---|---|---|---|---|---|---|
| Quadrant | DetID | PixID | Counts | Sigma | Mean | Median | Sigma |
| A | 12 | 189 | 162232 | 1539.59 | 457 | 446 | 105.1 |
| A | 15 | 223 | 65003 | 614.34 | 457 | 446 | 105.1 |
| A | 1 | 162 | 22869 | 213.38 | 457 | 446 | 105.1 |
| B | 4 | 239 | 1780778 | 21496.95 | 417 | 405 | 82.8 |
| B | 0 | 85 | 381143 | 4597.19 | 417 | 405 | 82.8 |
| B | 3 | 64 | 199924 | 2409.07 | 417 | 405 | 82.8 |
| C | 8 | 128 | 10297 | 96.16 | 450 | 442 | 102.5 |
| C | 12 | 4 | 9105 | 84.53 | 450 | 442 | 102.5 |
| C | 8 | 112 | 5788 | 52.17 | 450 | 442 | 102.5 |
| D | 1 | 52 | 244948 | 2272.32 | 451 | 433 | 107.6 |
| D | 10 | 157 | 50382 | 464.18 | 451 | 433 | 107.6 |
| D | 5 | 222 | 44505 | 409.57 | 451 | 433 | 107.6 |
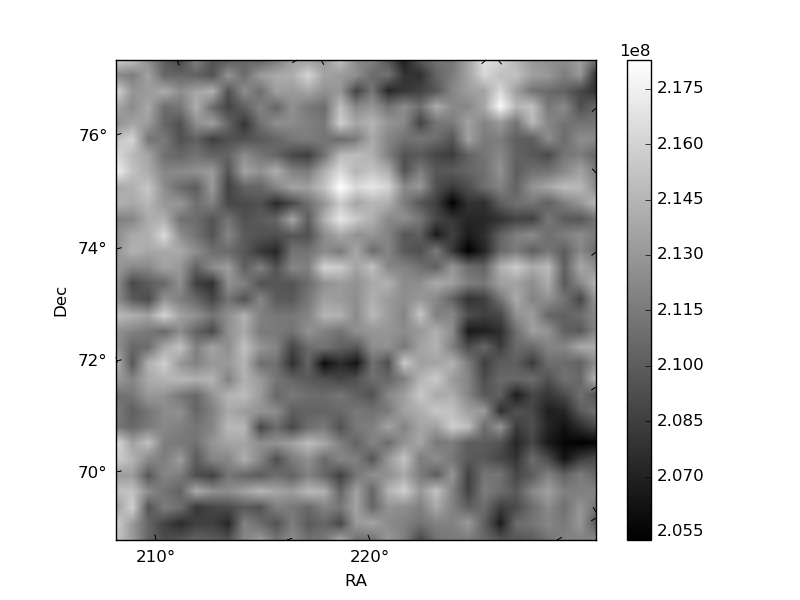
Histogram calculated using DETX and DETY for each event in the final _common_clean file
| Quadrant A |  |
 |
Quadrant B |
|---|---|---|---|
| Quadrant D | 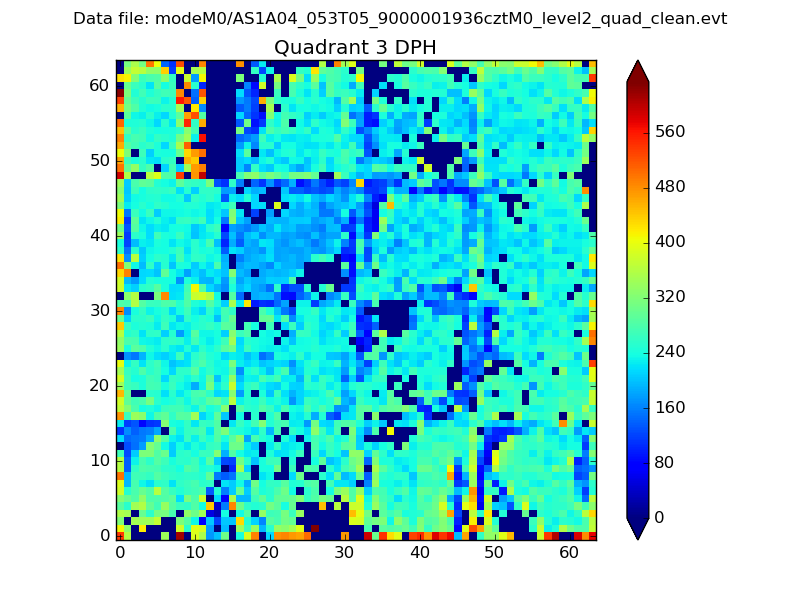 |
 |
Quadrant C |
| Plot type | Count rate plots | Images |
|---|---|---|
| Comparison with Poisson distribution Blue bars denote a histogram of data divided into 1 sec bins. Red curve is a Poisson curve with rate = median count rate of data. |
 |
 |
| Quadrant-wise count rates Data is divided into 100 sec bins |
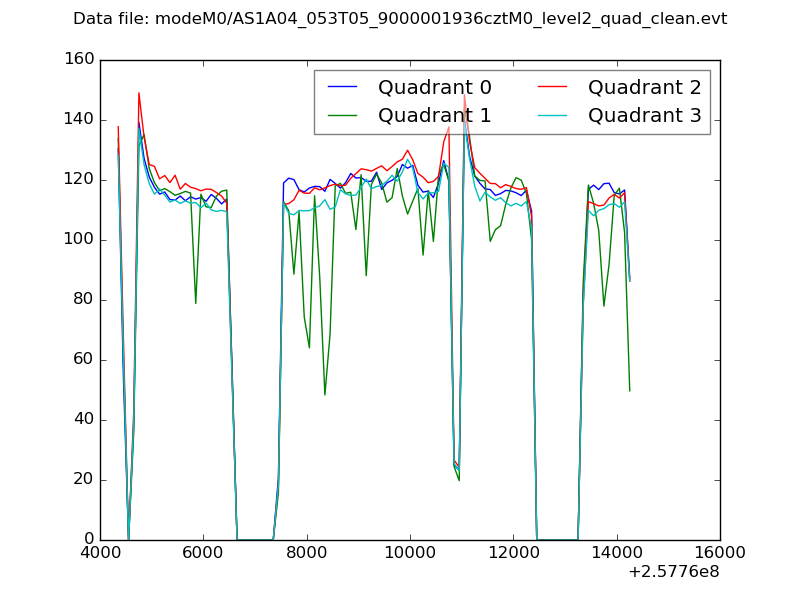 |
|
| Module-wise count rates for Quadrant A Data is divided into 100 sec bins |
 |
 |
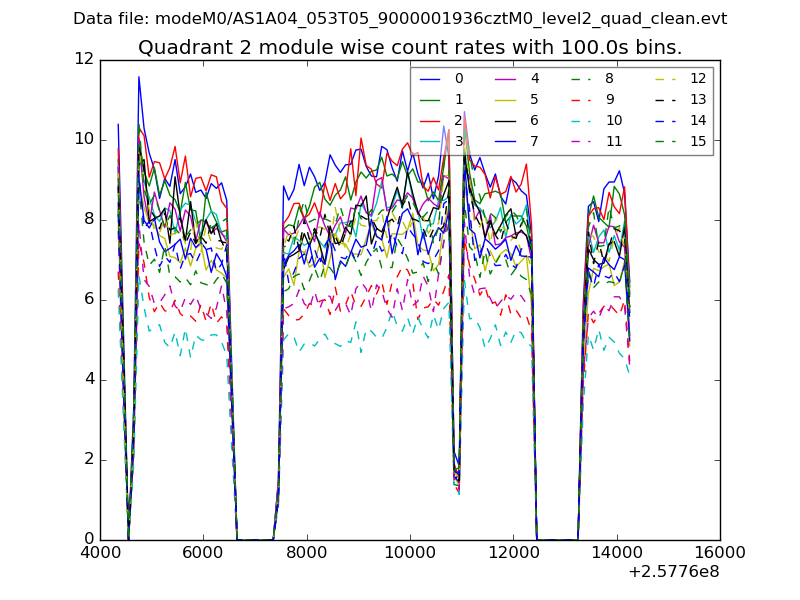
| Module-wise count rates for Quadrant B Data is divided into 100 sec bins |
 |
 |
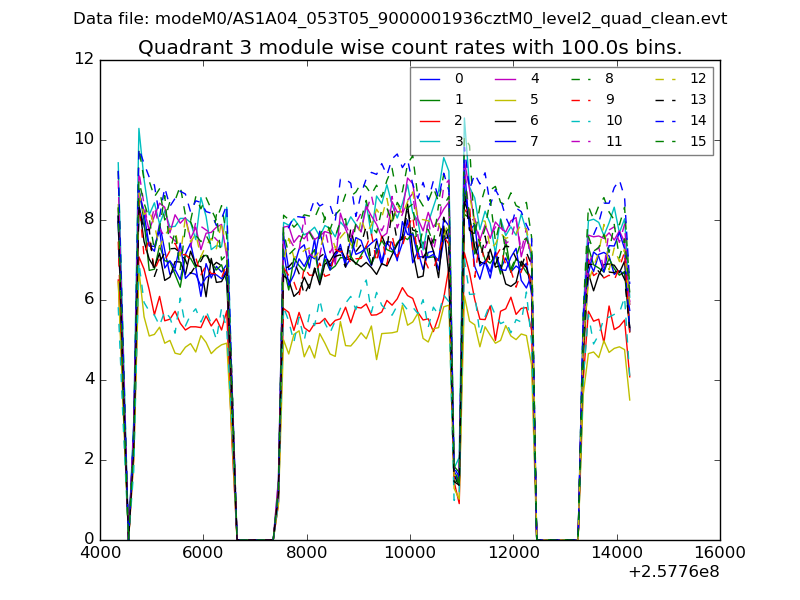
| Module-wise count rates for Quadrant C Data is divided into 100 sec bins |
 |
 |
| Module-wise count rates for Quadrant D Data is divided into 100 sec bins |
 |
 |
| Parameter | Plot |
|---|---|
| CZT HV Monitor |  |
| D_VDD |  |
| Temperature 1 |  |
| Veto HV Monitor |  |
| Veto LLD | 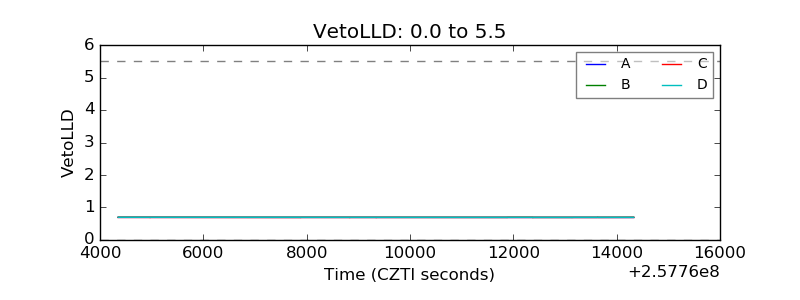 |
| Alpha Counter | 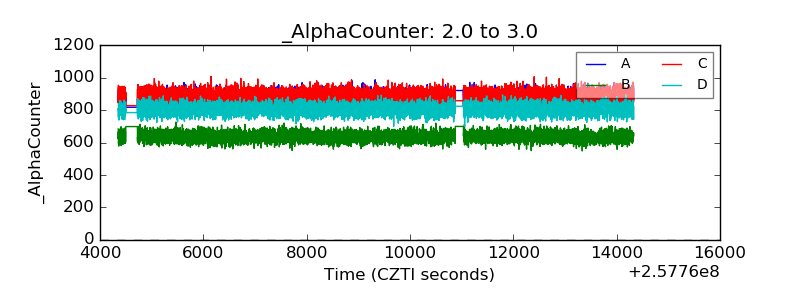 |
| _CPM_Rate |  |
| CZT Counter | 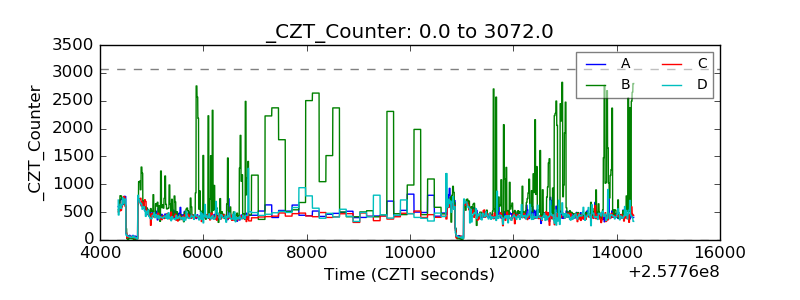 |
| +2.5 Volts monitor |  |
| +5 Volts monitor |  |
| _ROLL_ROT | 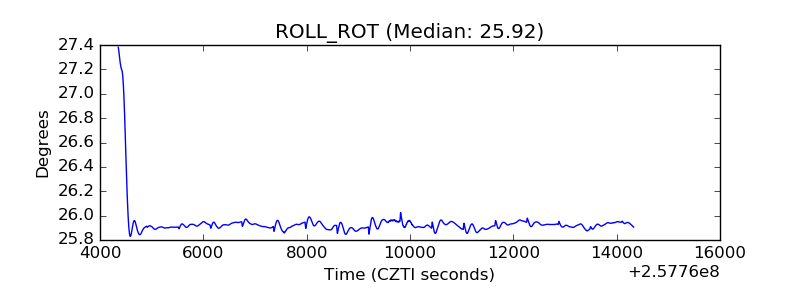 |
| _Roll_DEC |  |
| _Roll_RA |  |
| Veto Counter | 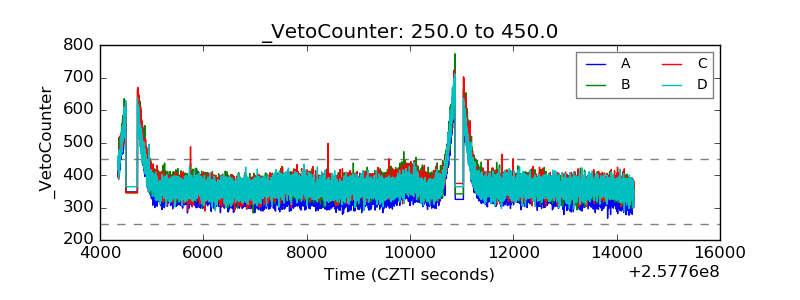 |