| Param | Original file | Final file |
|---|---|---|
| Filename | modeM0/AS1G08_031T02_9000001934cztM0_level2_bc.evt | modeM0/AS1G08_031T02_9000001934cztM0_level2_quad_clean.evt |
| Size (bytes) | 2,099,226,240 | 718,447,680 |
| Size | 2.0 GB | 685.2 MB |
| Events in quadrant A | 10,971,492 | 4,865,787 |
| Events in quadrant B | 16,987,702 | 4,648,444 |
| Events in quadrant C | 8,722,825 | 4,969,915 |
| Events in quadrant D | 23,891,975 | 4,254,371 |
| Mode M0 | |||
|---|---|---|---|
| Quadrant | BADHDUFLAG | Total packets | Discarded packets |
| A | 0 | 96121 | 0 |
| B | 0 | 127301 | 0 |
| C | 0 | 89750 | 0 |
| D | 0 | 151740 | 0 |
| Mode SS | |||
|---|---|---|---|
| Quadrant | BADHDUFLAG | Total packets | Discarded packets |
| A | 0 | 896 | 0 |
| B | 0 | 896 | 0 |
| C | 0 | 896 | 0 |
| D | 0 | 896 | 0 |
| Mode M9 | |||
|---|---|---|---|
| Quadrant | BADHDUFLAG | Total packets | Discarded packets |
| A | 0 | 88 | 0 |
| B | 0 | 88 | 0 |
| C | 0 | 88 | 0 |
| D | 0 | 88 | 0 |
| Quadrant | Total seconds | Saturated seconds | Saturation percentage |
|---|---|---|---|
| A | 43989 | 611 | 1.388984% |
| B | 43989 | 5238 | 11.907522% |
| C | 43989 | 115 | 0.261429% |
| D | 43989 | 7697 | 17.497556% |
Noise dominated data is calculated using 1-second bins in cleaned event files. If a bin has >2000 counts, and if more than 50% of those come from <1% of pixels, then it is considered to be noise-dominated and hence unusable.
| Quadrant | # 1 sec bins | Bins with >0 counts | Bins with >2000 counts | High rate bins dominated by noise | Noise dominated (total time) | Noise dominated (detector-on time) | Marked lightcurve |
|---|---|---|---|---|---|---|---|
| A | 52816 | 43989 | 174 | 174 | 0.33% | 0.40% | 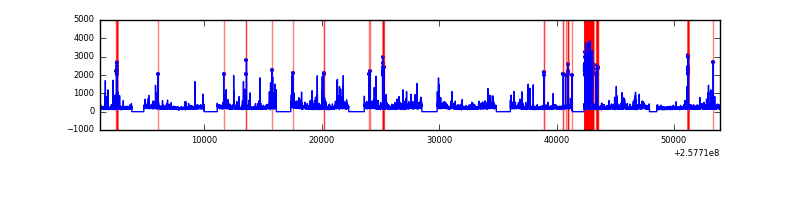 |
| B | 52816 | 43877 | 324 | 324 | 0.61% | 0.74% |  |
| C | 52816 | 43990 | 0 | 0 | 0.00% | 0.00% |  |
| D | 52816 | 43975 | 922 | 922 | 1.75% | 2.10% |  |
Top three noisy pixels from each quadrant. If the there are fewer than three noisy pixels in the level2.evt file, extra rows are filled as -1
| Pixel properties | Quadrant properties | ||||||
|---|---|---|---|---|---|---|---|
| Quadrant | DetID | PixID | Counts | Sigma | Mean | Median | Sigma |
| A | 4 | 2 | 792125 | 1636.69 | 2213 | 2170 | 482.7 |
| A | 12 | 189 | 691628 | 1428.48 | 2213 | 2170 | 482.7 |
| A | 0 | 23 | 549806 | 1134.64 | 2213 | 2170 | 482.7 |
| B | 4 | 239 | 4090797 | 10226.28 | 2108 | 2057 | 399.8 |
| B | 0 | 85 | 3332076 | 8328.65 | 2108 | 2057 | 399.8 |
| B | 3 | 64 | 823445 | 2054.36 | 2108 | 2057 | 399.8 |
| C | 15 | 208 | 51625 | 100.62 | 2208 | 2181 | 491.4 |
| C | 12 | 4 | 18557 | 33.33 | 2208 | 2181 | 491.4 |
| C | 14 | 234 | 14128 | 24.31 | 2208 | 2181 | 491.4 |
| D | 13 | 122 | 11205607 | 24195.04 | 2002 | 1939 | 463.1 |
| D | 1 | 52 | 4437080 | 9577.97 | 2002 | 1939 | 463.1 |
| D | 10 | 157 | 202114 | 432.29 | 2002 | 1939 | 463.1 |
Histogram calculated using DETX and DETY for each event in the final _common_clean file
| Quadrant A | 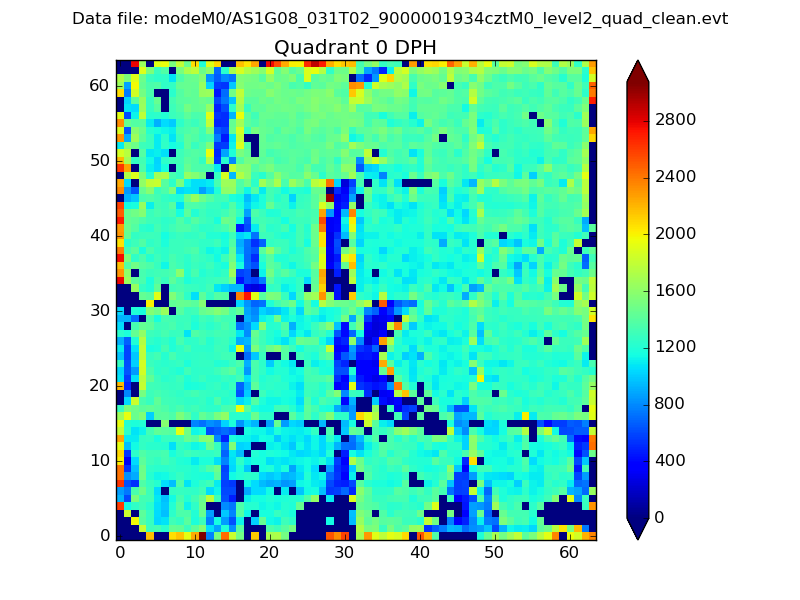 |
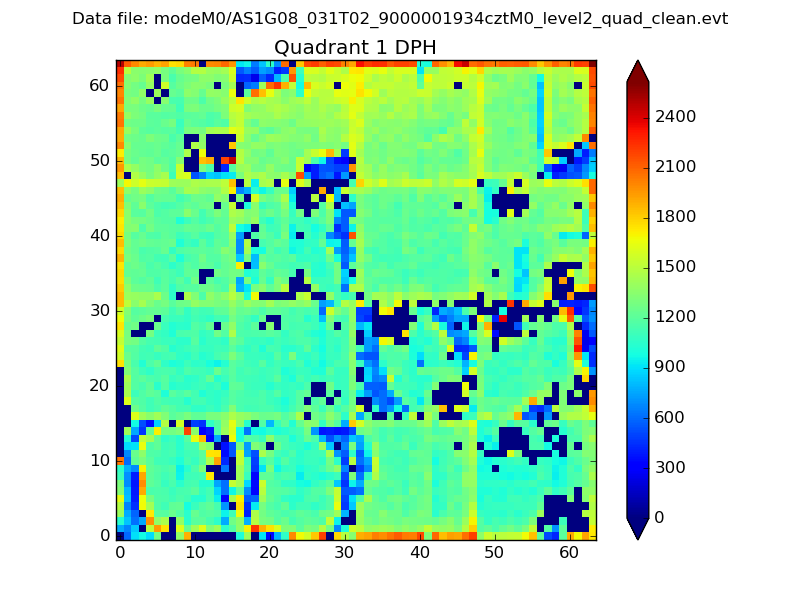 |
Quadrant B |
|---|---|---|---|
| Quadrant D |  |
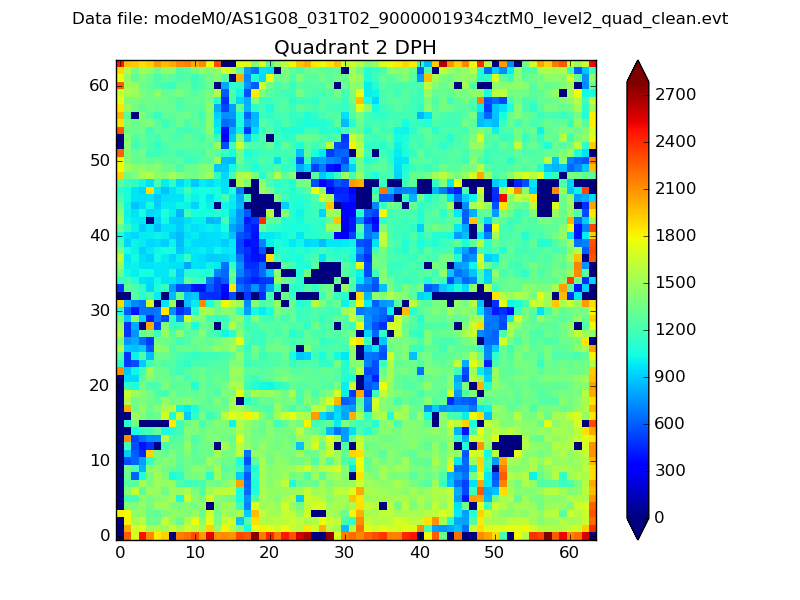 |
Quadrant C |
| Plot type | Count rate plots | Images |
|---|---|---|
| Comparison with Poisson distribution Blue bars denote a histogram of data divided into 1 sec bins. Red curve is a Poisson curve with rate = median count rate of data. |
 |
 |
| Quadrant-wise count rates Data is divided into 100 sec bins |
 |
|
| Module-wise count rates for Quadrant A Data is divided into 100 sec bins |
 |
 |
| Module-wise count rates for Quadrant B Data is divided into 100 sec bins |
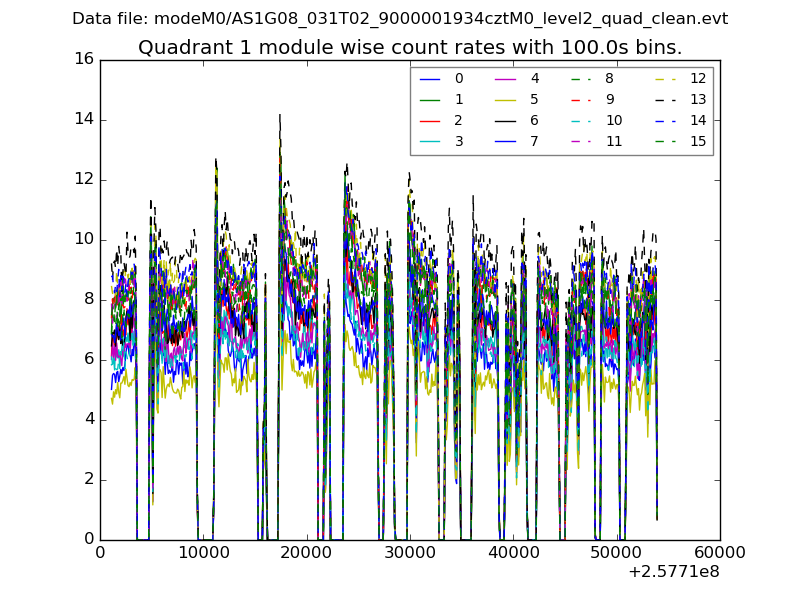 |
 |
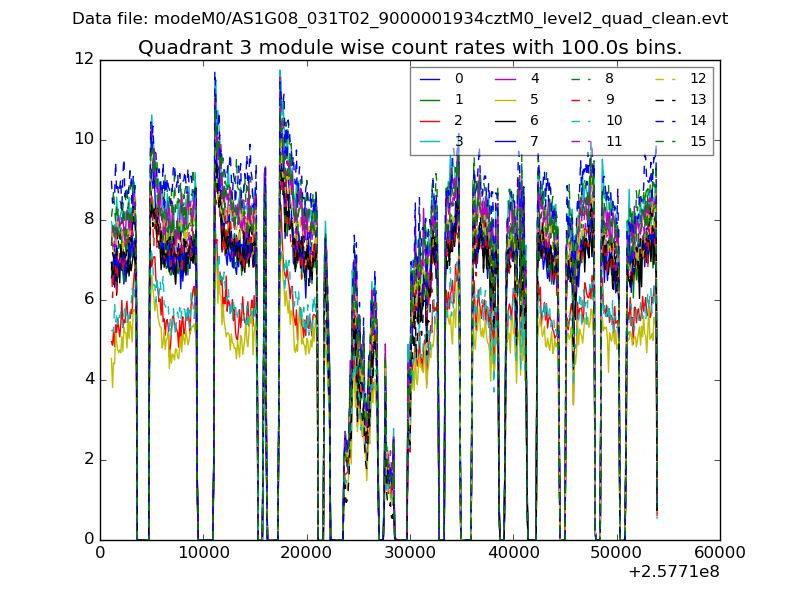
| Module-wise count rates for Quadrant C Data is divided into 100 sec bins |
 |
 |
| Module-wise count rates for Quadrant D Data is divided into 100 sec bins |
 |
 |
| Parameter | Plot |
|---|---|
| CZT HV Monitor |  |
| D_VDD |  |
| Temperature 1 |  |
| Veto HV Monitor |  |
| Veto LLD |  |
| Alpha Counter | 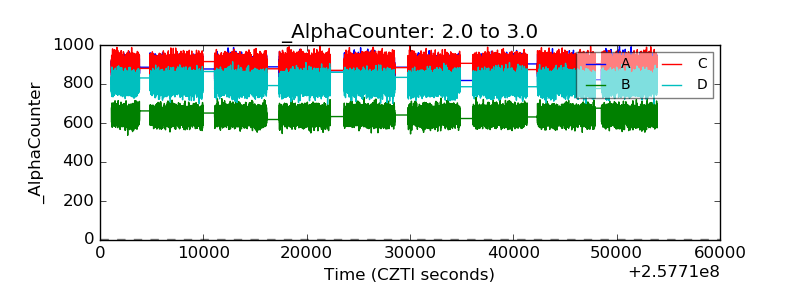 |
| _CPM_Rate |  |
| CZT Counter | 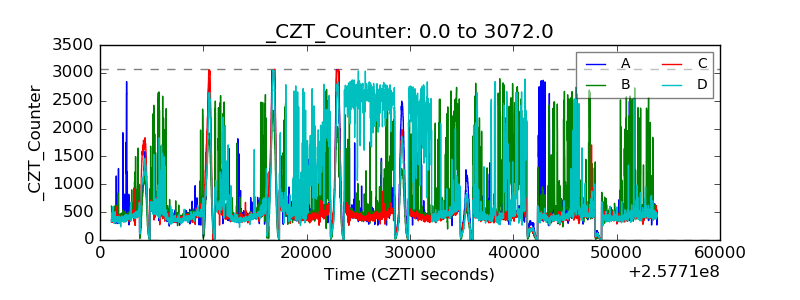 |
| +2.5 Volts monitor |  |
| +5 Volts monitor | 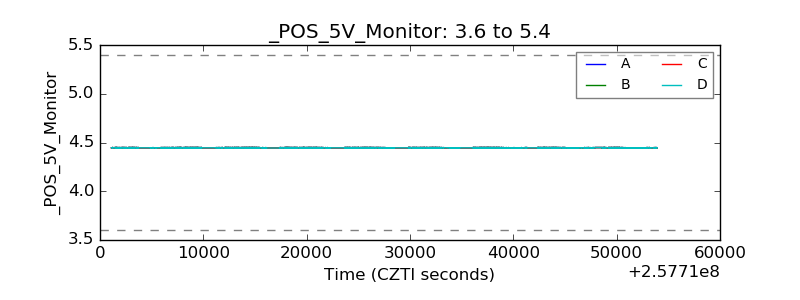 |
| _ROLL_ROT |  |
| _Roll_DEC | 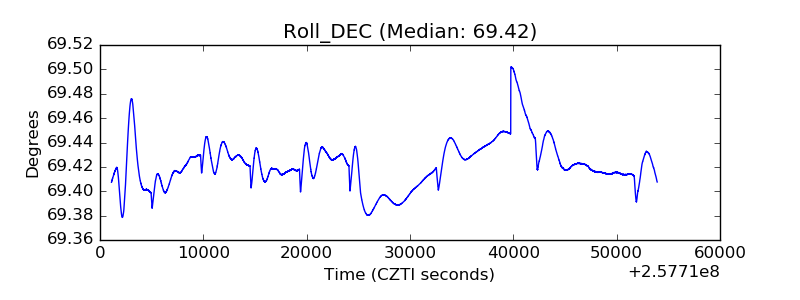 |
| _Roll_RA |  |
| Veto Counter | 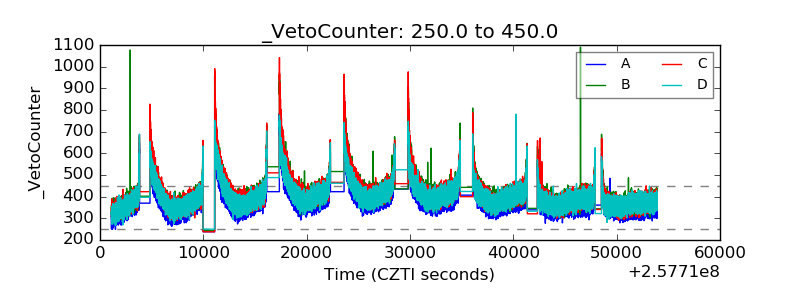 |