| Param | Original file | Final file |
|---|---|---|
| Filename | modeM0/AS1A04_017T01_9000001932cztM0_level2_bc.evt | modeM0/AS1A04_017T01_9000001932cztM0_level2_quad_clean.evt |
| Size (bytes) | 3,021,004,800 | 484,104,960 |
| Size | 2.8 GB | 461.7 MB |
| Events in quadrant A | 15,571,718 | 2,851,754 |
| Events in quadrant B | 23,562,454 | 2,436,732 |
| Events in quadrant C | 10,923,270 | 3,070,344 |
| Events in quadrant D | 37,675,365 | 2,518,944 |
| Mode M9 | |||
|---|---|---|---|
| Quadrant | BADHDUFLAG | Total packets | Discarded packets |
| A | 0 | 82 | 0 |
| B | 0 | 82 | 0 |
| C | 0 | 82 | 0 |
| D | 0 | 83 | 0 |
| Mode SS | |||
|---|---|---|---|
| Quadrant | BADHDUFLAG | Total packets | Discarded packets |
| A | 0 | 1122 | 0 |
| B | 0 | 1122 | 0 |
| C | 0 | 1122 | 0 |
| D | 0 | 1122 | 0 |
| Mode M0 | |||
|---|---|---|---|
| Quadrant | BADHDUFLAG | Total packets | Discarded packets |
| A | 0 | 148072 | 0 |
| B | 0 | 181268 | 0 |
| C | 0 | 113147 | 0 |
| D | 0 | 224323 | 0 |
| Quadrant | Total seconds | Saturated seconds | Saturation percentage |
|---|---|---|---|
| A | 55042 | 5283 | 9.598125% |
| B | 55042 | 10897 | 19.797609% |
| C | 55042 | 550 | 0.999237% |
| D | 55042 | 14919 | 27.104756% |
Noise dominated data is calculated using 1-second bins in cleaned event files. If a bin has >2000 counts, and if more than 50% of those come from <1% of pixels, then it is considered to be noise-dominated and hence unusable.
| Quadrant | # 1 sec bins | Bins with >0 counts | Bins with >2000 counts | High rate bins dominated by noise | Noise dominated (total time) | Noise dominated (detector-on time) | Marked lightcurve |
|---|---|---|---|---|---|---|---|
| A | 68204 | 55013 | 119 | 119 | 0.17% | 0.22% | 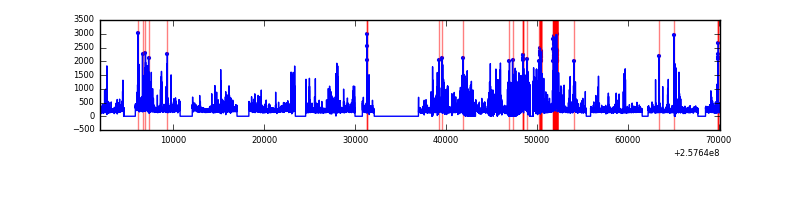 |
| B | 68204 | 54819 | 527 | 527 | 0.77% | 0.96% |  |
| C | 68204 | 55045 | 0 | 0 | 0.00% | 0.00% |  |
| D | 68204 | 55010 | 3249 | 3249 | 4.76% | 5.91% | 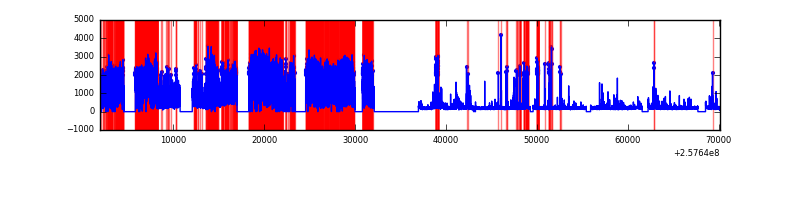 |
Top three noisy pixels from each quadrant. If the there are fewer than three noisy pixels in the level2.evt file, extra rows are filled as -1
| Pixel properties | Quadrant properties | ||||||
|---|---|---|---|---|---|---|---|
| Quadrant | DetID | PixID | Counts | Sigma | Mean | Median | Sigma |
| A | 15 | 223 | 2399864 | 4213.63 | 2643 | 2585 | 568.9 |
| A | 15 | 239 | 1016625 | 1782.35 | 2643 | 2585 | 568.9 |
| A | 12 | 189 | 874973 | 1533.37 | 2643 | 2585 | 568.9 |
| B | 4 | 239 | 9701526 | 20533.76 | 2502 | 2434 | 472.3 |
| B | 0 | 85 | 2703416 | 5718.2 | 2502 | 2434 | 472.3 |
| B | 3 | 64 | 1020202 | 2154.7 | 2502 | 2434 | 472.3 |
| C | 0 | 207 | 62701 | 98.14 | 2761 | 2719 | 611.2 |
| C | 12 | 4 | 24600 | 35.8 | 2761 | 2719 | 611.2 |
| C | 13 | 61 | 16445 | 22.46 | 2761 | 2719 | 611.2 |
| D | 13 | 122 | 22001743 | 40569.87 | 2333 | 2248 | 542.3 |
| D | 10 | 157 | 3307631 | 6095.55 | 2333 | 2248 | 542.3 |
| D | 1 | 52 | 2756161 | 5078.57 | 2333 | 2248 | 542.3 |
Histogram calculated using DETX and DETY for each event in the final _common_clean file
| Quadrant A |  |
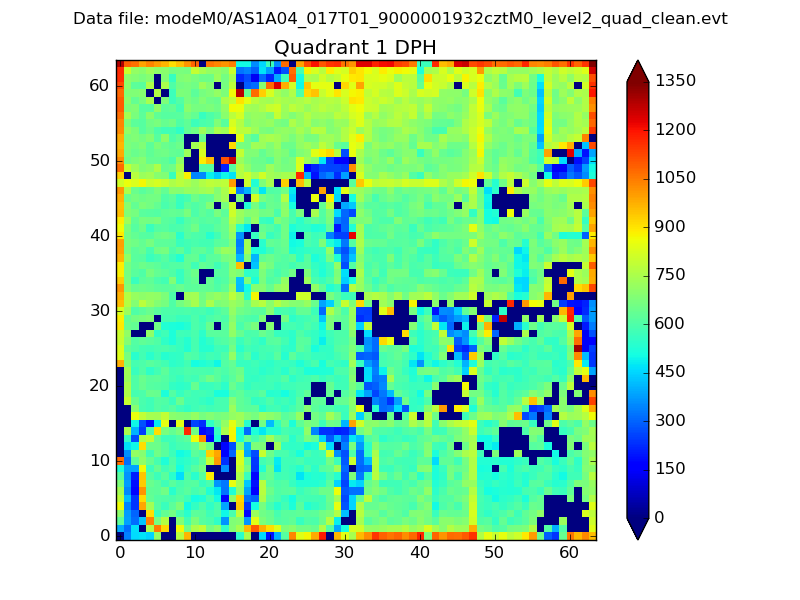 |
Quadrant B |
|---|---|---|---|
| Quadrant D |  |
 |
Quadrant C |
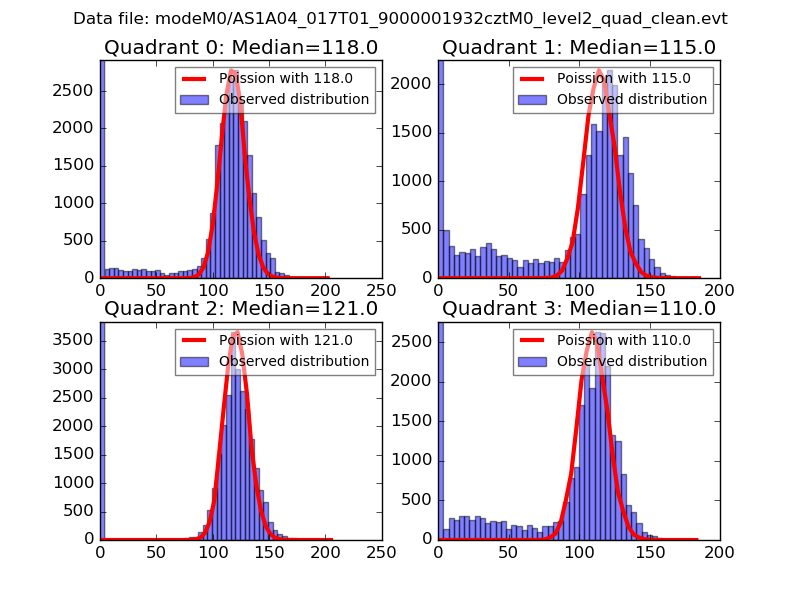
| Plot type | Count rate plots | Images |
|---|---|---|
| Comparison with Poisson distribution Blue bars denote a histogram of data divided into 1 sec bins. Red curve is a Poisson curve with rate = median count rate of data. |
 |
 |
| Quadrant-wise count rates Data is divided into 100 sec bins |
 |
|
| Module-wise count rates for Quadrant A Data is divided into 100 sec bins |
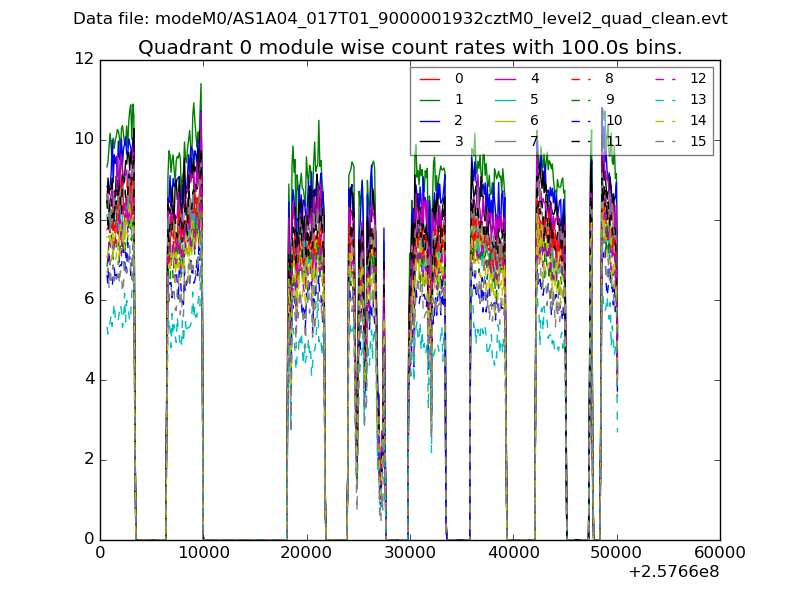 |
 |
| Module-wise count rates for Quadrant B Data is divided into 100 sec bins |
 |
 |
| Module-wise count rates for Quadrant C Data is divided into 100 sec bins |
 |
 |
| Module-wise count rates for Quadrant D Data is divided into 100 sec bins |
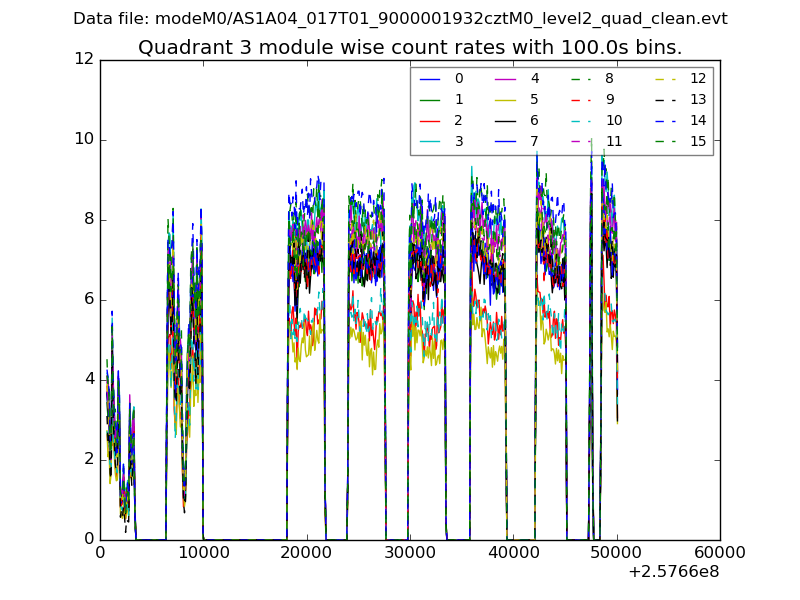 |
 |
| Parameter | Plot |
|---|---|
| CZT HV Monitor |  |
| D_VDD | 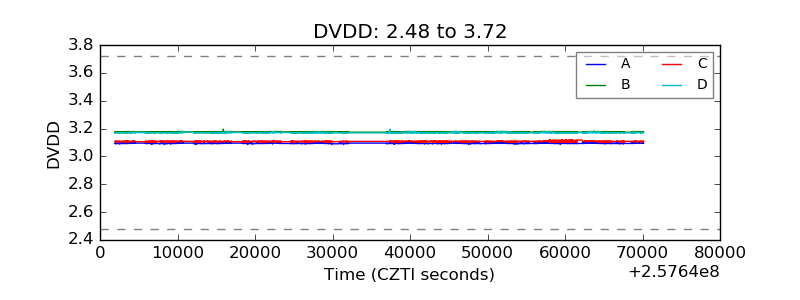 |
| Temperature 1 | 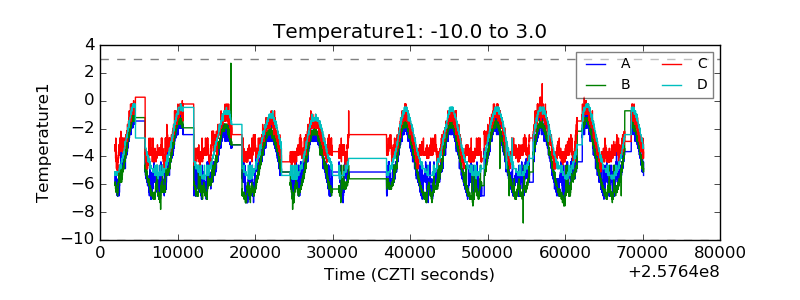 |
| Veto HV Monitor | 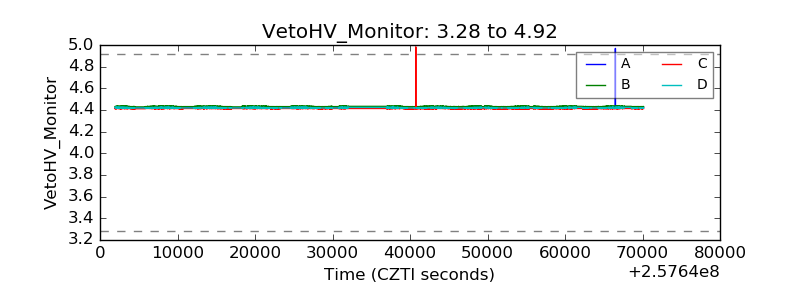 |
| Veto LLD |  |
| Alpha Counter |  |
| _CPM_Rate |  |
| CZT Counter |  |
| +2.5 Volts monitor |  |
| +5 Volts monitor |  |
| _ROLL_ROT |  |
| _Roll_DEC |  |
| _Roll_RA |  |
| Veto Counter | 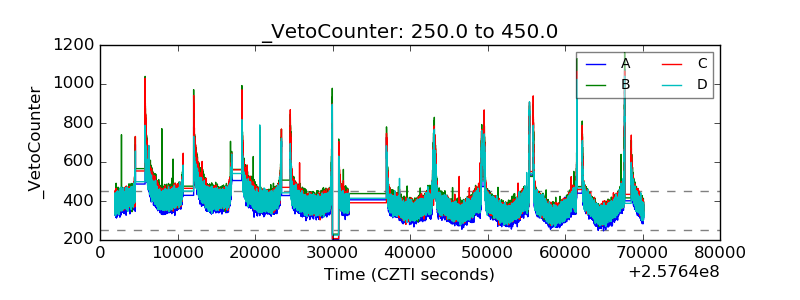 |