| Param | Original file | Final file |
|---|---|---|
| Filename | modeM0/AS1G08_037T01_9000001928cztM0_level2_bc.evt | modeM0/AS1G08_037T01_9000001928cztM0_level2_quad_clean.evt |
| Size (bytes) | 1,418,590,080 | 405,866,880 |
| Size | 1.3 GB | 387.1 MB |
| Events in quadrant A | 8,021,074 | 2,620,058 |
| Events in quadrant B | 14,894,707 | 2,376,327 |
| Events in quadrant C | 7,381,131 | 2,602,566 |
| Events in quadrant D | 10,424,046 | 2,439,382 |
| Mode M0 | |||
|---|---|---|---|
| Quadrant | BADHDUFLAG | Total packets | Discarded packets |
| A | 0 | 71502 | 0 |
| B | 0 | 113848 | 0 |
| C | 0 | 70261 | 0 |
| D | 0 | 81605 | 0 |
| Mode SS | |||
|---|---|---|---|
| Quadrant | BADHDUFLAG | Total packets | Discarded packets |
| A | 0 | 668 | 0 |
| B | 0 | 668 | 0 |
| C | 0 | 668 | 0 |
| D | 0 | 668 | 0 |
| Mode M9 | |||
|---|---|---|---|
| Quadrant | BADHDUFLAG | Total packets | Discarded packets |
| A | 0 | 35 | 0 |
| B | 0 | 35 | 0 |
| C | 0 | 35 | 0 |
| D | 0 | 35 | 0 |
| Quadrant | Total seconds | Saturated seconds | Saturation percentage |
|---|---|---|---|
| A | 32783 | 649 | 1.979685% |
| B | 32783 | 7378 | 22.505567% |
| C | 32783 | 485 | 1.479425% |
| D | 32783 | 1359 | 4.145441% |
Noise dominated data is calculated using 1-second bins in cleaned event files. If a bin has >2000 counts, and if more than 50% of those come from <1% of pixels, then it is considered to be noise-dominated and hence unusable.
| Quadrant | # 1 sec bins | Bins with >0 counts | Bins with >2000 counts | High rate bins dominated by noise | Noise dominated (total time) | Noise dominated (detector-on time) | Marked lightcurve |
|---|---|---|---|---|---|---|---|
| A | 41502 | 32785 | 15 | 15 | 0.04% | 0.05% |  |
| B | 41502 | 32443 | 316 | 316 | 0.76% | 0.97% |  |
| C | 41502 | 32784 | 21 | 21 | 0.05% | 0.06% |  |
| D | 41502 | 32784 | 154 | 154 | 0.37% | 0.47% | 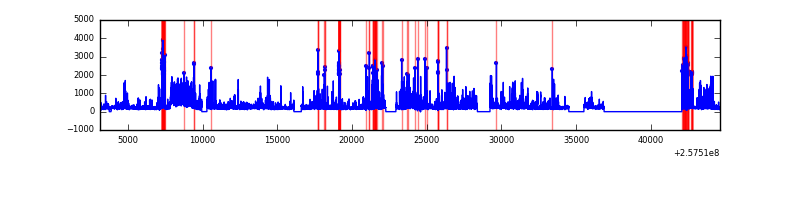 |
Top three noisy pixels from each quadrant. If the there are fewer than three noisy pixels in the level2.evt file, extra rows are filled as -1
| Pixel properties | Quadrant properties | ||||||
|---|---|---|---|---|---|---|---|
| Quadrant | DetID | PixID | Counts | Sigma | Mean | Median | Sigma |
| A | 12 | 189 | 708253 | 1942.95 | 1636 | 1602 | 363.7 |
| A | 8 | 15 | 392320 | 1074.29 | 1636 | 1602 | 363.7 |
| A | 15 | 223 | 236363 | 645.48 | 1636 | 1602 | 363.7 |
| B | 4 | 239 | 5542381 | 19619.39 | 1434 | 1391 | 282.4 |
| B | 0 | 85 | 2492525 | 8820.54 | 1434 | 1391 | 282.4 |
| B | 3 | 64 | 480824 | 1697.56 | 1434 | 1391 | 282.4 |
| C | 15 | 208 | 984594 | 2749.27 | 1610 | 1583 | 357.6 |
| C | 8 | 112 | 32673 | 86.95 | 1610 | 1583 | 357.6 |
| C | 14 | 234 | 21129 | 54.66 | 1610 | 1583 | 357.6 |
| D | 1 | 52 | 2317183 | 6249.81 | 1589 | 1532 | 370.5 |
| D | 14 | 34 | 1112708 | 2999.0 | 1589 | 1532 | 370.5 |
| D | 8 | 195 | 363395 | 976.65 | 1589 | 1532 | 370.5 |
Histogram calculated using DETX and DETY for each event in the final _common_clean file
| Quadrant A |  |
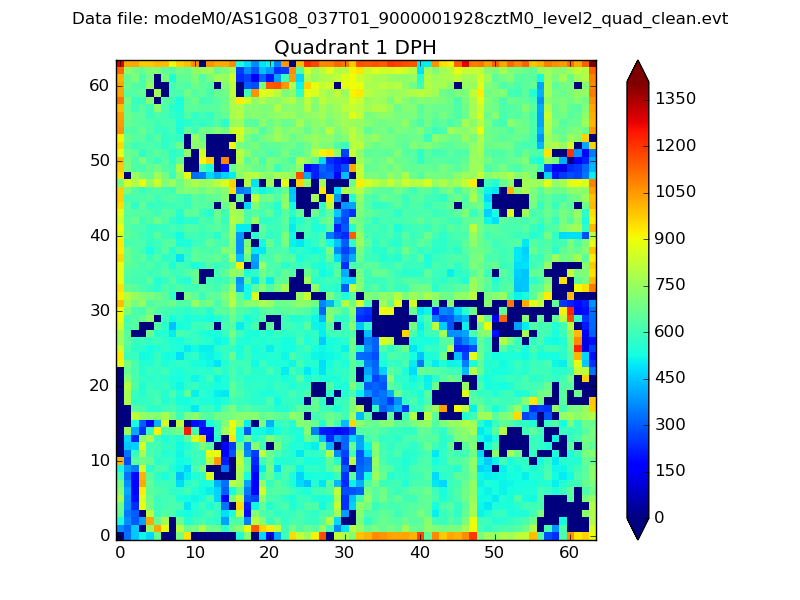 |
Quadrant B |
|---|---|---|---|
| Quadrant D |  |
 |
Quadrant C |
| Plot type | Count rate plots | Images |
|---|---|---|
| Comparison with Poisson distribution Blue bars denote a histogram of data divided into 1 sec bins. Red curve is a Poisson curve with rate = median count rate of data. |
 |
 |
| Quadrant-wise count rates Data is divided into 100 sec bins |
 |
|
| Module-wise count rates for Quadrant A Data is divided into 100 sec bins |
 |
 |
| Module-wise count rates for Quadrant B Data is divided into 100 sec bins |
 |
 |
| Module-wise count rates for Quadrant C Data is divided into 100 sec bins |
 |
 |
| Module-wise count rates for Quadrant D Data is divided into 100 sec bins |
 |
 |
| Parameter | Plot |
|---|---|
| CZT HV Monitor |  |
| D_VDD |  |
| Temperature 1 |  |
| Veto HV Monitor |  |
| Veto LLD |  |
| Alpha Counter |  |
| _CPM_Rate |  |
| CZT Counter |  |
| +2.5 Volts monitor | 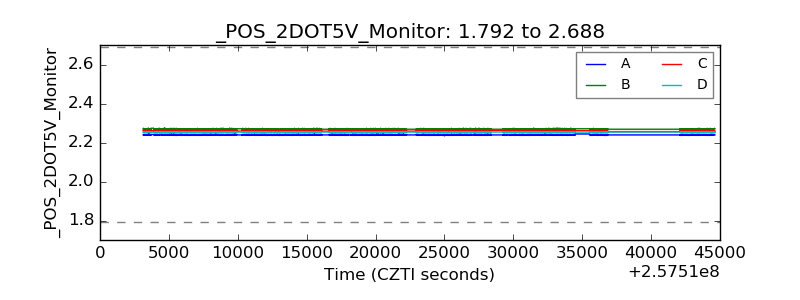 |
| +5 Volts monitor |  |
| _ROLL_ROT |  |
| _Roll_DEC |  |
| _Roll_RA |  |
| Veto Counter |  |