| Param | Original file | Final file |
|---|---|---|
| Filename | modeM0/AS1C03_023T01_9000001930cztM0_level2_bc.evt | modeM0/AS1C03_023T01_9000001930cztM0_level2_quad_clean.evt |
| Size (bytes) | 3,171,288,960 | 882,959,040 |
| Size | 3.0 GB | 842.1 MB |
| Events in quadrant A | 17,417,807 | 5,534,738 |
| Events in quadrant B | 28,925,742 | 5,376,425 |
| Events in quadrant C | 14,232,619 | 5,656,733 |
| Events in quadrant D | 30,593,028 | 5,271,568 |
| Mode M0 | |||
|---|---|---|---|
| Quadrant | BADHDUFLAG | Total packets | Discarded packets |
| A | 0 | 159101 | 0 |
| B | 0 | 232487 | 0 |
| C | 0 | 146809 | 0 |
| D | 0 | 207221 | 0 |
| Mode M9 | |||
|---|---|---|---|
| Quadrant | BADHDUFLAG | Total packets | Discarded packets |
| A | 0 | 115 | 0 |
| B | 0 | 115 | 0 |
| C | 0 | 115 | 0 |
| D | 0 | 115 | 0 |
| Mode SS | |||
|---|---|---|---|
| Quadrant | BADHDUFLAG | Total packets | Discarded packets |
| A | 0 | 1456 | 0 |
| B | 0 | 1456 | 0 |
| C | 0 | 1456 | 0 |
| D | 0 | 1456 | 0 |
| Quadrant | Total seconds | Saturated seconds | Saturation percentage |
|---|---|---|---|
| A | 71488 | 1672 | 2.338854% |
| B | 71489 | 12676 | 17.731399% |
| C | 71489 | 498 | 0.696611% |
| D | 71489 | 4414 | 6.174376% |
Noise dominated data is calculated using 1-second bins in cleaned event files. If a bin has >2000 counts, and if more than 50% of those come from <1% of pixels, then it is considered to be noise-dominated and hence unusable.
| Quadrant | # 1 sec bins | Bins with >0 counts | Bins with >2000 counts | High rate bins dominated by noise | Noise dominated (total time) | Noise dominated (detector-on time) | Marked lightcurve |
|---|---|---|---|---|---|---|---|
| A | 85061 | 71492 | 128 | 128 | 0.15% | 0.18% |  |
| B | 85061 | 71415 | 549 | 549 | 0.65% | 0.77% | 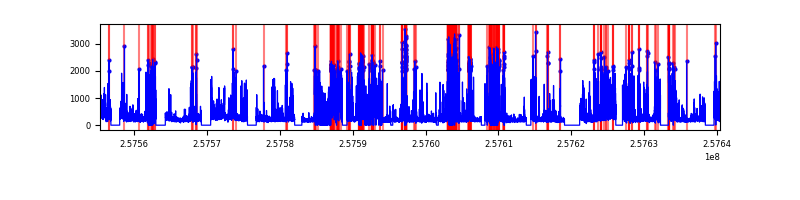 |
| C | 85061 | 71493 | 3 | 3 | 0.00% | 0.00% | 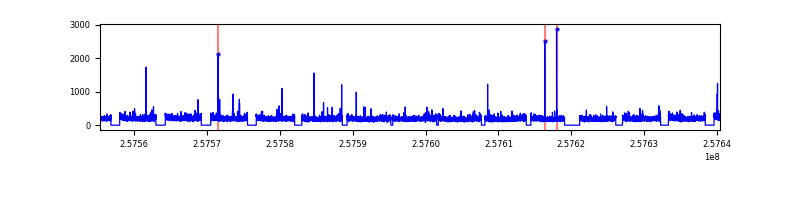 |
| D | 85061 | 71487 | 635 | 635 | 0.75% | 0.89% |  |
Top three noisy pixels from each quadrant. If the there are fewer than three noisy pixels in the level2.evt file, extra rows are filled as -1
| Pixel properties | Quadrant properties | ||||||
|---|---|---|---|---|---|---|---|
| Quadrant | DetID | PixID | Counts | Sigma | Mean | Median | Sigma |
| A | 15 | 223 | 1460562 | 1865.17 | 3588 | 3512 | 781.2 |
| A | 12 | 189 | 1086366 | 1386.17 | 3588 | 3512 | 781.2 |
| A | 15 | 239 | 562105 | 715.06 | 3588 | 3512 | 781.2 |
| B | 0 | 85 | 11200594 | 18023.69 | 3283 | 3189 | 621.3 |
| B | 4 | 239 | 3208696 | 5159.68 | 3283 | 3189 | 621.3 |
| B | 3 | 64 | 910501 | 1460.44 | 3283 | 3189 | 621.3 |
| C | 14 | 234 | 61074 | 73.32 | 3592 | 3544 | 784.7 |
| C | 0 | 207 | 29087 | 32.55 | 3592 | 3544 | 784.7 |
| C | 8 | 128 | 28653 | 32.0 | 3592 | 3544 | 784.7 |
| D | 1 | 52 | 6246000 | 7731.0 | 3514 | 3388 | 807.5 |
| D | 13 | 122 | 4898513 | 6062.24 | 3514 | 3388 | 807.5 |
| D | 10 | 157 | 4051499 | 5013.28 | 3514 | 3388 | 807.5 |
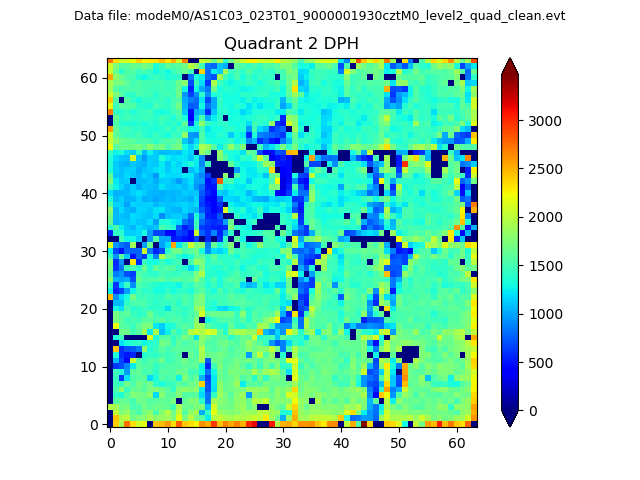
Histogram calculated using DETX and DETY for each event in the final _common_clean file
| Quadrant A |  |
 |
Quadrant B |
|---|---|---|---|
| Quadrant D | 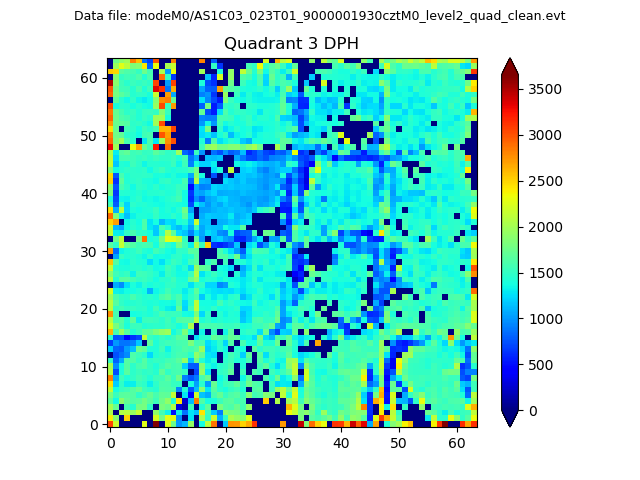 |
 |
Quadrant C |
| Plot type | Count rate plots | Images |
|---|---|---|
| Comparison with Poisson distribution Blue bars denote a histogram of data divided into 1 sec bins. Red curve is a Poisson curve with rate = median count rate of data. |
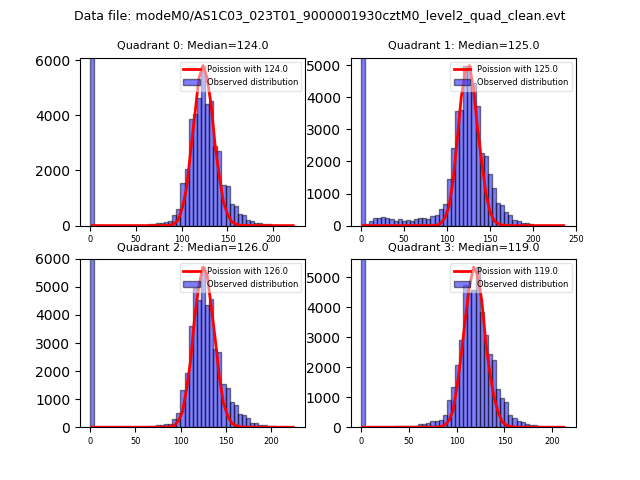 |
 |
| Quadrant-wise count rates Data is divided into 100 sec bins |
 |
|
| Module-wise count rates for Quadrant A Data is divided into 100 sec bins |
 |
 |
| Module-wise count rates for Quadrant B Data is divided into 100 sec bins |
 |
 |
| Module-wise count rates for Quadrant C Data is divided into 100 sec bins |
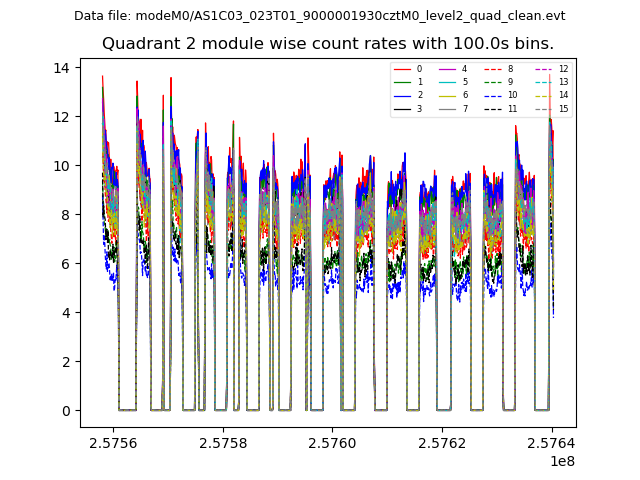 |
 |
| Module-wise count rates for Quadrant D Data is divided into 100 sec bins |
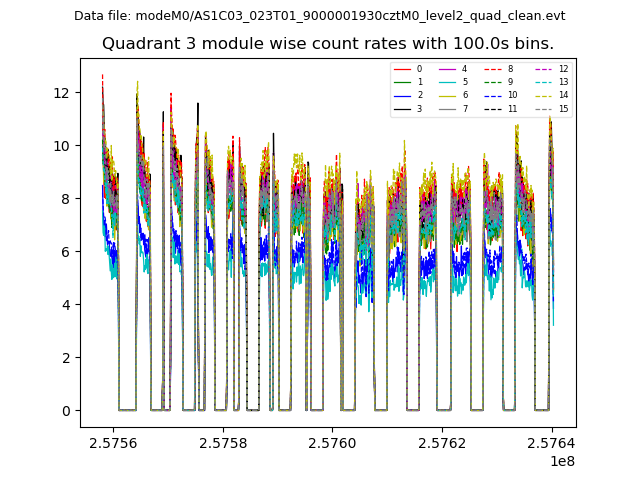 |
 |
| Parameter | Plot |
|---|---|
| CZT HV Monitor |  |
| D_VDD |  |
| Temperature 1 |  |
| Veto HV Monitor |  |
| Veto LLD |  |
| Alpha Counter |  |
| _CPM_Rate |  |
| CZT Counter |  |
| +2.5 Volts monitor | 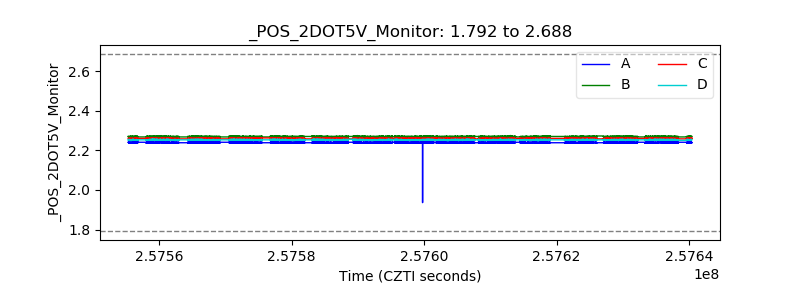 |
| +5 Volts monitor |  |
| _ROLL_ROT |  |
| _Roll_DEC | 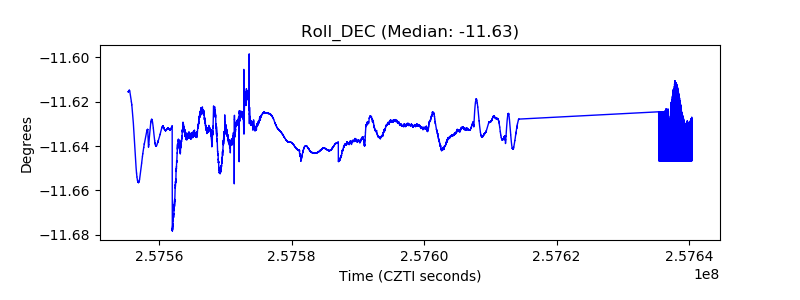 |
| _Roll_RA |  |
| Veto Counter |  |