| Param | Original file | Final file |
|---|---|---|
| Filename | modeM0/AS1A04_176T02_9000001924cztM0_level2_bc.evt | modeM0/AS1A04_176T02_9000001924cztM0_level2_quad_clean.evt |
| Size (bytes) | 2,512,468,800 | 405,904,320 |
| Size | 2.3 GB | 387.1 MB |
| Events in quadrant A | 8,313,687 | 2,686,224 |
| Events in quadrant B | 17,492,703 | 2,434,668 |
| Events in quadrant C | 7,240,305 | 2,709,977 |
| Events in quadrant D | 40,621,806 | 2,017,884 |
| Mode SS | |||
|---|---|---|---|
| Quadrant | BADHDUFLAG | Total packets | Discarded packets |
| A | 0 | 724 | 0 |
| B | 0 | 724 | 0 |
| C | 0 | 724 | 0 |
| D | 0 | 724 | 0 |
| Mode M0 | |||
|---|---|---|---|
| Quadrant | BADHDUFLAG | Total packets | Discarded packets |
| A | 0 | 77640 | 0 |
| B | 0 | 132936 | 0 |
| C | 0 | 73545 | 0 |
| D | 0 | 180209 | 0 |
| Mode M9 | |||
|---|---|---|---|
| Quadrant | BADHDUFLAG | Total packets | Discarded packets |
| A | 0 | 48 | 0 |
| B | 0 | 48 | 0 |
| C | 0 | 48 | 0 |
| D | 0 | 48 | 0 |
| Quadrant | Total seconds | Saturated seconds | Saturation percentage |
|---|---|---|---|
| A | 35515 | 803 | 2.261016% |
| B | 35517 | 9407 | 26.485908% |
| C | 35517 | 402 | 1.131852% |
| D | 35515 | 14482 | 40.777136% |
Noise dominated data is calculated using 1-second bins in cleaned event files. If a bin has >2000 counts, and if more than 50% of those come from <1% of pixels, then it is considered to be noise-dominated and hence unusable.
| Quadrant | # 1 sec bins | Bins with >0 counts | Bins with >2000 counts | High rate bins dominated by noise | Noise dominated (total time) | Noise dominated (detector-on time) | Marked lightcurve |
|---|---|---|---|---|---|---|---|
| A | 40373 | 35518 | 1 | 1 | 0.00% | 0.00% |  |
| B | 40373 | 35492 | 771 | 771 | 1.91% | 2.17% | 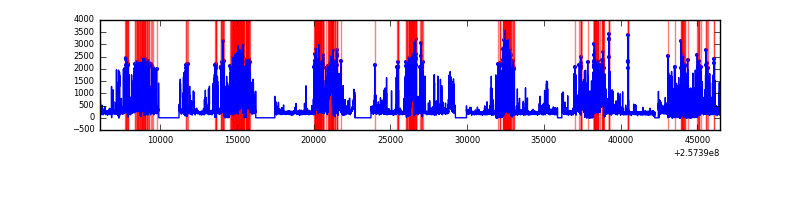 |
| C | 40373 | 35520 | 0 | 0 | 0.00% | 0.00% | 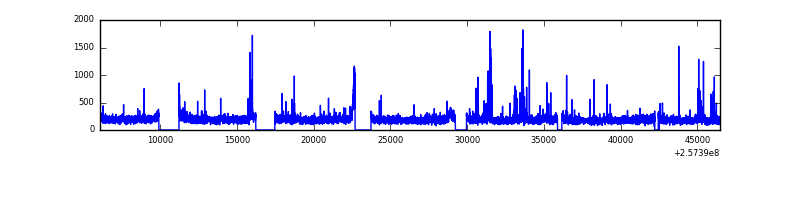 |
| D | 40373 | 35516 | 10281 | 10281 | 25.47% | 28.95% |  |
Top three noisy pixels from each quadrant. If the there are fewer than three noisy pixels in the level2.evt file, extra rows are filled as -1
| Pixel properties | Quadrant properties | ||||||
|---|---|---|---|---|---|---|---|
| Quadrant | DetID | PixID | Counts | Sigma | Mean | Median | Sigma |
| A | 12 | 189 | 391208 | 964.66 | 1821 | 1784 | 403.7 |
| A | 15 | 223 | 382963 | 944.24 | 1821 | 1784 | 403.7 |
| A | 8 | 15 | 268814 | 661.47 | 1821 | 1784 | 403.7 |
| B | 4 | 239 | 7477744 | 25186.99 | 1532 | 1489 | 296.8 |
| B | 0 | 85 | 3617451 | 12181.93 | 1532 | 1489 | 296.8 |
| B | 0 | 219 | 114735 | 381.52 | 1532 | 1489 | 296.8 |
| C | 15 | 208 | 156685 | 388.02 | 1792 | 1763 | 399.3 |
| C | 14 | 234 | 40314 | 96.56 | 1792 | 1763 | 399.3 |
| C | 12 | 4 | 16506 | 36.93 | 1792 | 1763 | 399.3 |
| D | 1 | 52 | 33666020 | 101716.59 | 1416 | 1366 | 331.0 |
| D | 10 | 157 | 866113 | 2612.8 | 1416 | 1366 | 331.0 |
| D | 1 | 255 | 145413 | 435.23 | 1416 | 1366 | 331.0 |
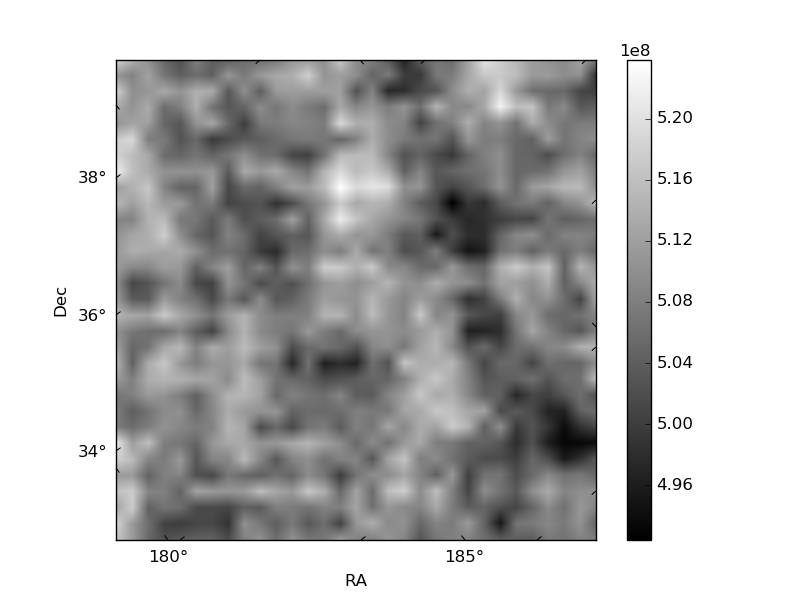
Histogram calculated using DETX and DETY for each event in the final _common_clean file
| Quadrant A |  |
 |
Quadrant B |
|---|---|---|---|
| Quadrant D |  |
 |
Quadrant C |
| Plot type | Count rate plots | Images |
|---|---|---|
| Comparison with Poisson distribution Blue bars denote a histogram of data divided into 1 sec bins. Red curve is a Poisson curve with rate = median count rate of data. |
 |
 |
| Quadrant-wise count rates Data is divided into 100 sec bins |
 |
|
| Module-wise count rates for Quadrant A Data is divided into 100 sec bins |
 |
 |
| Module-wise count rates for Quadrant B Data is divided into 100 sec bins |
 |
 |
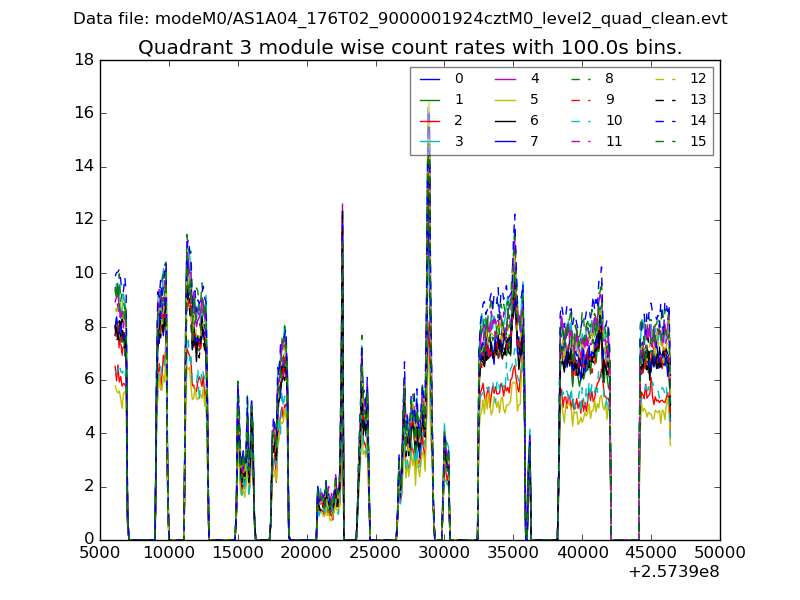
| Module-wise count rates for Quadrant C Data is divided into 100 sec bins |
 |
 |
| Module-wise count rates for Quadrant D Data is divided into 100 sec bins |
 |
 |
| Parameter | Plot |
|---|---|
| CZT HV Monitor | 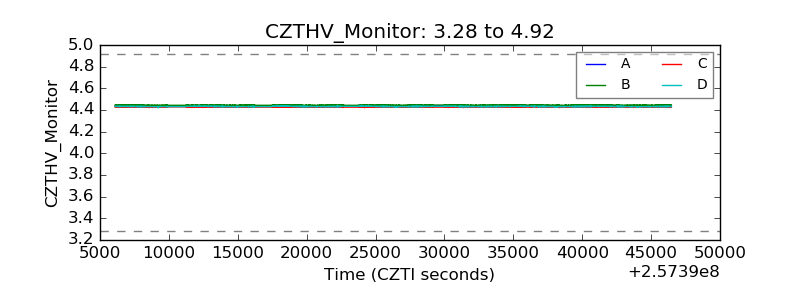 |
| D_VDD |  |
| Temperature 1 |  |
| Veto HV Monitor |  |
| Veto LLD |  |
| Alpha Counter | 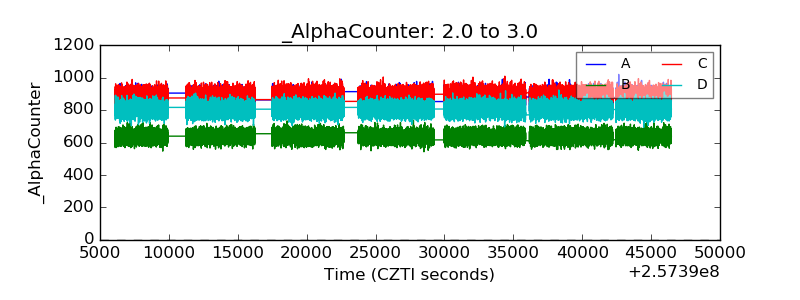 |
| _CPM_Rate | 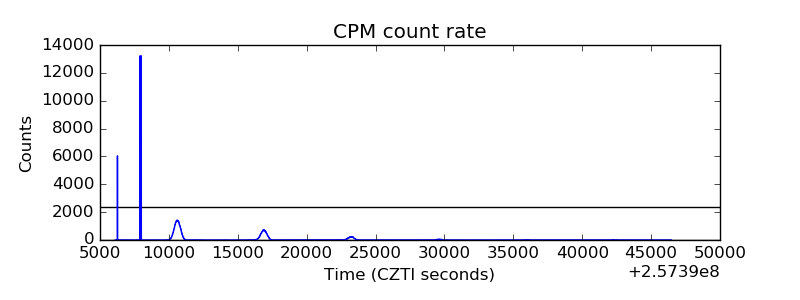 |
| CZT Counter | 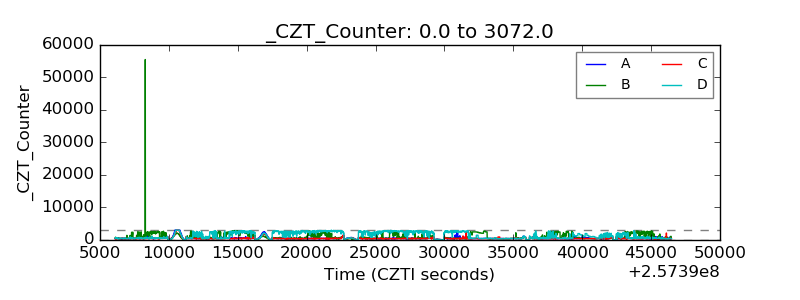 |
| +2.5 Volts monitor |  |
| +5 Volts monitor |  |
| _ROLL_ROT |  |
| _Roll_DEC |  |
| _Roll_RA |  |
| Veto Counter |  |