| Param | Original file | Final file |
|---|---|---|
| Filename | modeM0/AS1A04_067T01_9000001926cztM0_level2_bc.evt | modeM0/AS1A04_067T01_9000001926cztM0_level2_quad_clean.evt |
| Size (bytes) | 2,502,152,640 | 770,621,760 |
| Size | 2.3 GB | 734.9 MB |
| Events in quadrant A | 13,703,482 | 4,908,509 |
| Events in quadrant B | 21,816,748 | 4,560,046 |
| Events in quadrant C | 15,008,231 | 4,949,864 |
| Events in quadrant D | 21,026,029 | 4,673,536 |
| Mode M0 | |||
|---|---|---|---|
| Quadrant | BADHDUFLAG | Total packets | Discarded packets |
| A | 0 | 130126 | 0 |
| B | 0 | 182323 | 0 |
| C | 0 | 136124 | 0 |
| D | 0 | 155957 | 0 |
| Mode M9 | |||
|---|---|---|---|
| Quadrant | BADHDUFLAG | Total packets | Discarded packets |
| A | 0 | 101 | 0 |
| B | 0 | 100 | 0 |
| C | 0 | 102 | 0 |
| D | 0 | 103 | 0 |
| Mode SS | |||
|---|---|---|---|
| Quadrant | BADHDUFLAG | Total packets | Discarded packets |
| A | 0 | 1120 | 0 |
| B | 0 | 1286 | 0 |
| C | 0 | 1284 | 0 |
| D | 0 | 1282 | 0 |
| Quadrant | Total seconds | Saturated seconds | Saturation percentage |
|---|---|---|---|
| A | 62003 | 554 | 0.893505% |
| B | 61937 | 8978 | 14.495374% |
| C | 61995 | 906 | 1.461408% |
| D | 61964 | 1987 | 3.206701% |
Noise dominated data is calculated using 1-second bins in cleaned event files. If a bin has >2000 counts, and if more than 50% of those come from <1% of pixels, then it is considered to be noise-dominated and hence unusable.
| Quadrant | # 1 sec bins | Bins with >0 counts | Bins with >2000 counts | High rate bins dominated by noise | Noise dominated (total time) | Noise dominated (detector-on time) | Marked lightcurve |
|---|---|---|---|---|---|---|---|
| A | 75204 | 62282 | 14 | 14 | 0.02% | 0.02% |  |
| B | 75204 | 61956 | 403 | 403 | 0.54% | 0.65% |  |
| C | 75204 | 62288 | 135 | 135 | 0.18% | 0.22% |  |
| D | 75204 | 62249 | 324 | 324 | 0.43% | 0.52% |  |
Top three noisy pixels from each quadrant. If the there are fewer than three noisy pixels in the level2.evt file, extra rows are filled as -1
| Pixel properties | Quadrant properties | ||||||
|---|---|---|---|---|---|---|---|
| Quadrant | DetID | PixID | Counts | Sigma | Mean | Median | Sigma |
| A | 12 | 189 | 635495 | 935.89 | 3095 | 3038 | 675.8 |
| A | 8 | 15 | 551917 | 812.22 | 3095 | 3038 | 675.8 |
| A | 15 | 223 | 135780 | 196.43 | 3095 | 3038 | 675.8 |
| B | 4 | 239 | 6342787 | 11850.13 | 2834 | 2761 | 535.0 |
| B | 0 | 85 | 2483522 | 4636.78 | 2834 | 2761 | 535.0 |
| B | 3 | 64 | 819603 | 1526.76 | 2834 | 2761 | 535.0 |
| C | 15 | 208 | 2982887 | 4427.53 | 3039 | 2999 | 673.0 |
| C | 14 | 234 | 84760 | 121.48 | 3039 | 2999 | 673.0 |
| C | 12 | 4 | 20960 | 26.69 | 3039 | 2999 | 673.0 |
| D | 1 | 52 | 7651541 | 10930.78 | 3023 | 2913 | 699.7 |
| D | 10 | 157 | 537724 | 764.31 | 3023 | 2913 | 699.7 |
| D | 14 | 34 | 316800 | 448.58 | 3023 | 2913 | 699.7 |
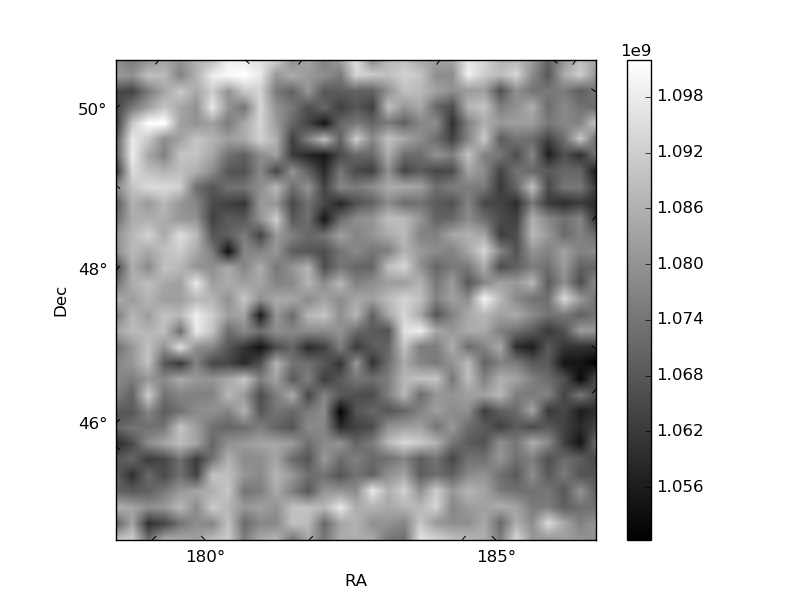
Histogram calculated using DETX and DETY for each event in the final _common_clean file
| Quadrant A |  |
 |
Quadrant B |
|---|---|---|---|
| Quadrant D |  |
 |
Quadrant C |
| Plot type | Count rate plots | Images |
|---|---|---|
| Comparison with Poisson distribution Blue bars denote a histogram of data divided into 1 sec bins. Red curve is a Poisson curve with rate = median count rate of data. |
 |
 |
| Quadrant-wise count rates Data is divided into 100 sec bins |
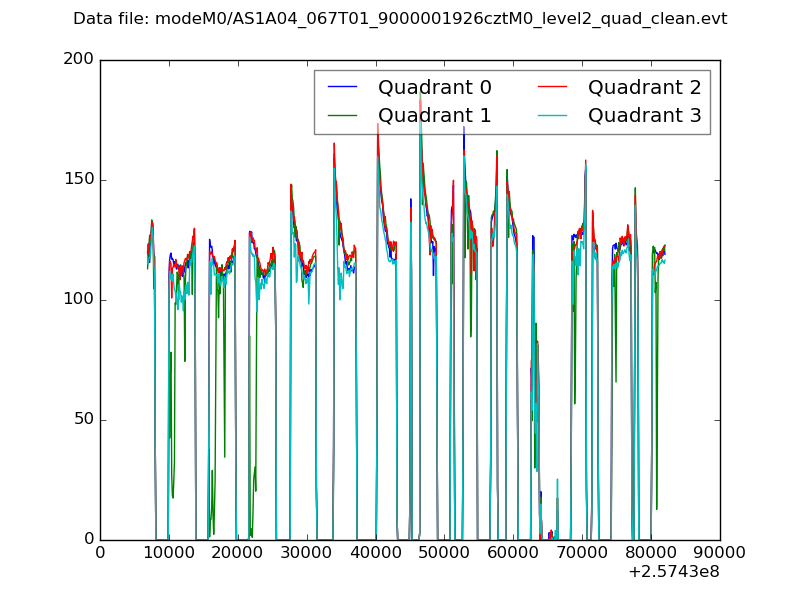 |
|
| Module-wise count rates for Quadrant A Data is divided into 100 sec bins |
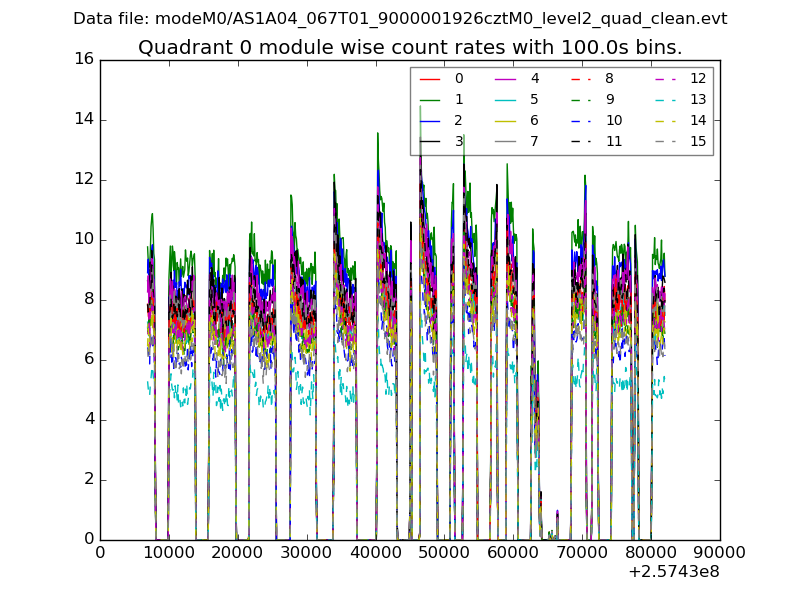 |
 |
| Module-wise count rates for Quadrant B Data is divided into 100 sec bins |
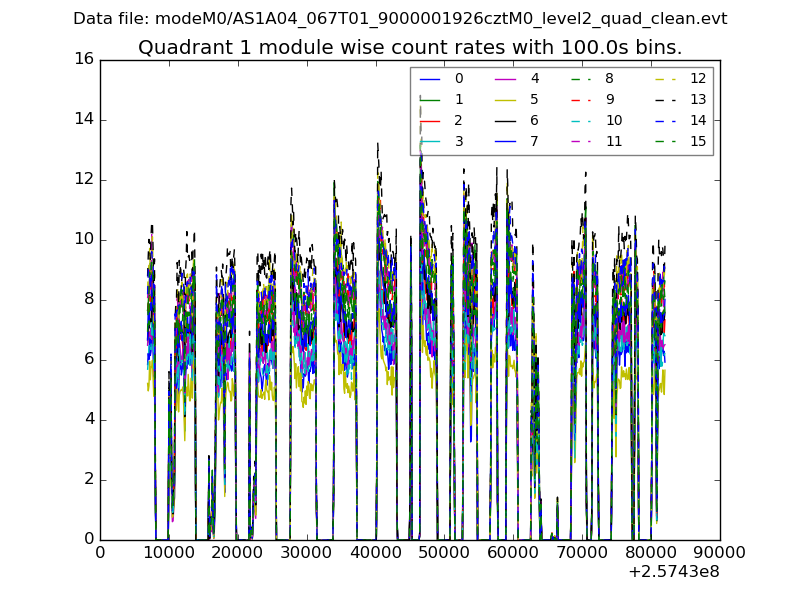 |
 |
| Module-wise count rates for Quadrant C Data is divided into 100 sec bins |
 |
 |
| Module-wise count rates for Quadrant D Data is divided into 100 sec bins |
 |
 |
| Parameter | Plot |
|---|---|
| CZT HV Monitor | 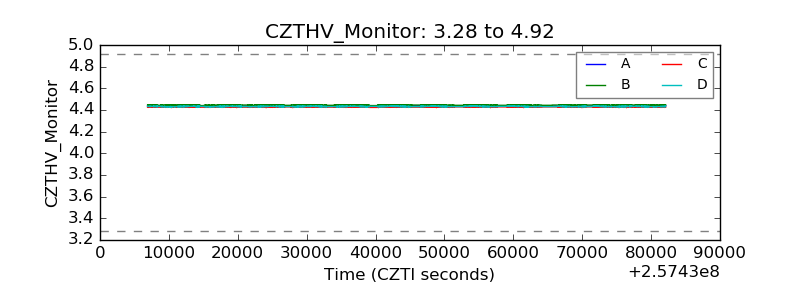 |
| D_VDD |  |
| Temperature 1 |  |
| Veto HV Monitor |  |
| Veto LLD |  |
| Alpha Counter |  |
| _CPM_Rate |  |
| CZT Counter |  |
| +2.5 Volts monitor |  |
| +5 Volts monitor |  |
| _ROLL_ROT |  |
| _Roll_DEC |  |
| _Roll_RA |  |
| Veto Counter |  |