| Param | Original file | Final file |
|---|---|---|
| Filename | modeM0/AS1G08_068T01_9000001922cztM0_level2_bc.evt | modeM0/AS1G08_068T01_9000001922cztM0_level2_quad_clean.evt |
| Size (bytes) | 2,021,688,000 | 505,117,440 |
| Size | 1.9 GB | 481.7 MB |
| Events in quadrant A | 9,063,764 | 3,333,542 |
| Events in quadrant B | 18,074,103 | 3,124,403 |
| Events in quadrant C | 7,792,595 | 3,374,662 |
| Events in quadrant D | 23,626,202 | 2,775,551 |
| Mode SS | |||
|---|---|---|---|
| Quadrant | BADHDUFLAG | Total packets | Discarded packets |
| A | 0 | 798 | 0 |
| B | 0 | 796 | 0 |
| C | 0 | 798 | 0 |
| D | 0 | 796 | 0 |
| Mode M9 | |||
|---|---|---|---|
| Quadrant | BADHDUFLAG | Total packets | Discarded packets |
| A | 0 | 68 | 0 |
| B | 0 | 68 | 0 |
| C | 0 | 68 | 0 |
| D | 0 | 68 | 0 |
| Mode M0 | |||
|---|---|---|---|
| Quadrant | BADHDUFLAG | Total packets | Discarded packets |
| A | 0 | 83855 | 0 |
| B | 0 | 130682 | 0 |
| C | 0 | 80234 | 0 |
| D | 0 | 130762 | 0 |
| Quadrant | Total seconds | Saturated seconds | Saturation percentage |
|---|---|---|---|
| A | 39148 | 622 | 1.588842% |
| B | 39145 | 7185 | 18.354835% |
| C | 39143 | 325 | 0.830289% |
| D | 39140 | 6603 | 16.870210% |
Noise dominated data is calculated using 1-second bins in cleaned event files. If a bin has >2000 counts, and if more than 50% of those come from <1% of pixels, then it is considered to be noise-dominated and hence unusable.
| Quadrant | # 1 sec bins | Bins with >0 counts | Bins with >2000 counts | High rate bins dominated by noise | Noise dominated (total time) | Noise dominated (detector-on time) | Marked lightcurve |
|---|---|---|---|---|---|---|---|
| A | 51078 | 39205 | 3 | 3 | 0.01% | 0.01% |  |
| B | 51078 | 39163 | 450 | 450 | 0.88% | 1.15% |  |
| C | 51078 | 39193 | 5 | 5 | 0.01% | 0.01% |  |
| D | 51078 | 39196 | 4898 | 4898 | 9.59% | 12.50% |  |
Top three noisy pixels from each quadrant. If the there are fewer than three noisy pixels in the level2.evt file, extra rows are filled as -1
| Pixel properties | Quadrant properties | ||||||
|---|---|---|---|---|---|---|---|
| Quadrant | DetID | PixID | Counts | Sigma | Mean | Median | Sigma |
| A | 12 | 189 | 710110 | 1629.11 | 1978 | 1938 | 434.7 |
| A | 8 | 15 | 159570 | 362.62 | 1978 | 1938 | 434.7 |
| A | 5 | 16 | 127014 | 287.73 | 1978 | 1938 | 434.7 |
| B | 4 | 239 | 7419388 | 21600.59 | 1795 | 1746 | 343.4 |
| B | 0 | 85 | 2254407 | 6559.87 | 1795 | 1746 | 343.4 |
| B | 3 | 64 | 477182 | 1384.5 | 1795 | 1746 | 343.4 |
| C | 8 | 128 | 26577 | 56.61 | 1967 | 1945 | 435.1 |
| C | 7 | 221 | 18327 | 37.65 | 1967 | 1945 | 435.1 |
| C | 8 | 112 | 15944 | 32.17 | 1967 | 1945 | 435.1 |
| D | 1 | 52 | 15514614 | 37361.93 | 1769 | 1705 | 415.2 |
| D | 8 | 195 | 441723 | 1059.76 | 1769 | 1705 | 415.2 |
| D | 7 | 223 | 320056 | 766.73 | 1769 | 1705 | 415.2 |
Histogram calculated using DETX and DETY for each event in the final _common_clean file
| Quadrant A | 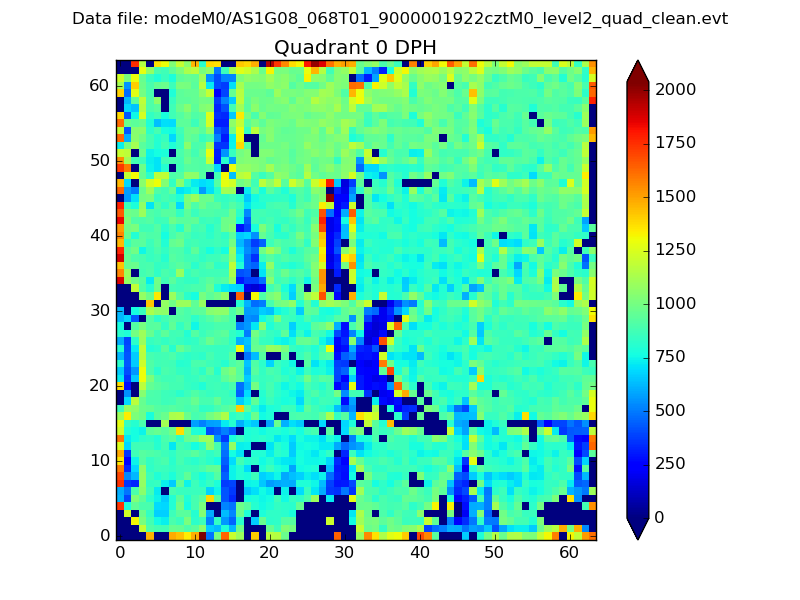 |
 |
Quadrant B |
|---|---|---|---|
| Quadrant D |  |
 |
Quadrant C |
| Plot type | Count rate plots | Images |
|---|---|---|
| Comparison with Poisson distribution Blue bars denote a histogram of data divided into 1 sec bins. Red curve is a Poisson curve with rate = median count rate of data. |
 |
 |
| Quadrant-wise count rates Data is divided into 100 sec bins |
 |
|
| Module-wise count rates for Quadrant A Data is divided into 100 sec bins |
 |
 |
| Module-wise count rates for Quadrant B Data is divided into 100 sec bins |
 |
 |
| Module-wise count rates for Quadrant C Data is divided into 100 sec bins |
 |
 |
| Module-wise count rates for Quadrant D Data is divided into 100 sec bins |
 |
 |
| Parameter | Plot |
|---|---|
| CZT HV Monitor |  |
| D_VDD |  |
| Temperature 1 |  |
| Veto HV Monitor |  |
| Veto LLD |  |
| Alpha Counter |  |
| _CPM_Rate |  |
| CZT Counter |  |
| +2.5 Volts monitor |  |
| +5 Volts monitor |  |
| _ROLL_ROT | 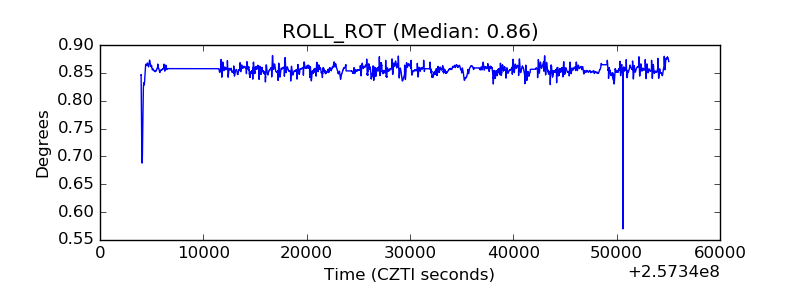 |
| _Roll_DEC |  |
| _Roll_RA | 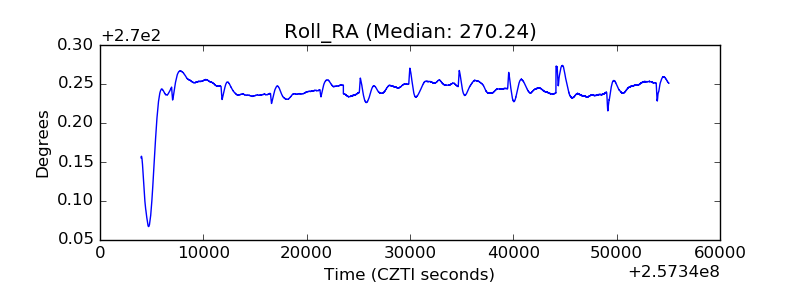 |
| Veto Counter |  |