| Param | Original file | Final file |
|---|---|---|
| Filename | modeM0/AS1G08_045T01_9000001920cztM0_level2_bc.evt | modeM0/AS1G08_045T01_9000001920cztM0_level2_quad_clean.evt |
| Size (bytes) | 2,930,178,240 | 879,802,560 |
| Size | 2.7 GB | 839.0 MB |
| Events in quadrant A | 16,996,918 | 5,726,310 |
| Events in quadrant B | 30,042,474 | 5,109,980 |
| Events in quadrant C | 13,509,372 | 5,808,581 |
| Events in quadrant D | 23,638,427 | 5,422,400 |
| Mode SS | |||
|---|---|---|---|
| Quadrant | BADHDUFLAG | Total packets | Discarded packets |
| A | 0 | 1356 | 0 |
| B | 0 | 1356 | 0 |
| C | 0 | 1356 | 0 |
| D | 0 | 1356 | 0 |
| Mode M9 | |||
|---|---|---|---|
| Quadrant | BADHDUFLAG | Total packets | Discarded packets |
| A | 0 | 113 | 0 |
| B | 0 | 113 | 0 |
| C | 0 | 113 | 0 |
| D | 0 | 113 | 0 |
| Mode M0 | |||
|---|---|---|---|
| Quadrant | BADHDUFLAG | Total packets | Discarded packets |
| A | 0 | 147753 | 0 |
| B | 0 | 235588 | 0 |
| C | 0 | 136774 | 0 |
| D | 0 | 172559 | 0 |
| Quadrant | Total seconds | Saturated seconds | Saturation percentage |
|---|---|---|---|
| A | 66774 | 977 | 1.463144% |
| B | 66764 | 15368 | 23.018393% |
| C | 66766 | 467 | 0.699458% |
| D | 66776 | 2680 | 4.013418% |
Noise dominated data is calculated using 1-second bins in cleaned event files. If a bin has >2000 counts, and if more than 50% of those come from <1% of pixels, then it is considered to be noise-dominated and hence unusable.
| Quadrant | # 1 sec bins | Bins with >0 counts | Bins with >2000 counts | High rate bins dominated by noise | Noise dominated (total time) | Noise dominated (detector-on time) | Marked lightcurve |
|---|---|---|---|---|---|---|---|
| A | 77979 | 66801 | 58 | 58 | 0.07% | 0.09% |  |
| B | 77979 | 66545 | 735 | 735 | 0.94% | 1.10% |  |
| C | 77979 | 66803 | 3 | 3 | 0.00% | 0.00% |  |
| D | 77979 | 66804 | 524 | 524 | 0.67% | 0.78% | 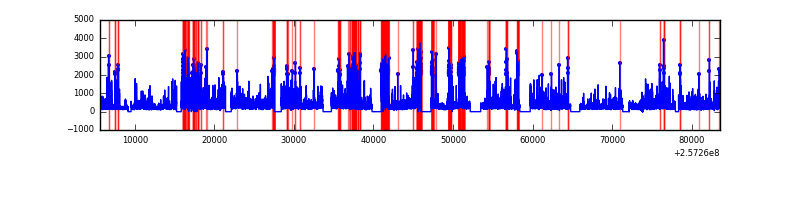 |
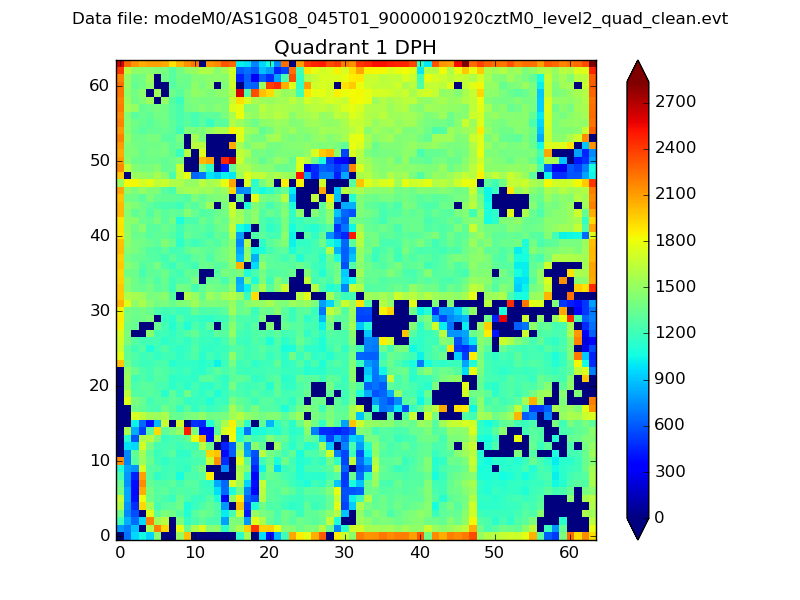
Top three noisy pixels from each quadrant. If the there are fewer than three noisy pixels in the level2.evt file, extra rows are filled as -1
| Pixel properties | Quadrant properties | ||||||
|---|---|---|---|---|---|---|---|
| Quadrant | DetID | PixID | Counts | Sigma | Mean | Median | Sigma |
| A | 8 | 15 | 1632232 | 2178.52 | 3414 | 3348 | 747.7 |
| A | 12 | 189 | 993273 | 1323.96 | 3414 | 3348 | 747.7 |
| A | 15 | 223 | 358162 | 474.54 | 3414 | 3348 | 747.7 |
| B | 4 | 239 | 11807039 | 21113.36 | 2908 | 2832 | 559.1 |
| B | 0 | 85 | 4349960 | 7775.4 | 2908 | 2832 | 559.1 |
| B | 3 | 64 | 1139536 | 2033.14 | 2908 | 2832 | 559.1 |
| C | 14 | 234 | 57231 | 71.59 | 3413 | 3381 | 752.2 |
| C | 12 | 4 | 27545 | 32.12 | 3413 | 3381 | 752.2 |
| C | 8 | 222 | 23166 | 26.3 | 3413 | 3381 | 752.2 |
| D | 1 | 52 | 7748628 | 9840.65 | 3352 | 3236 | 787.1 |
| D | 8 | 195 | 1319061 | 1671.78 | 3352 | 3236 | 787.1 |
| D | 14 | 34 | 830636 | 1051.23 | 3352 | 3236 | 787.1 |
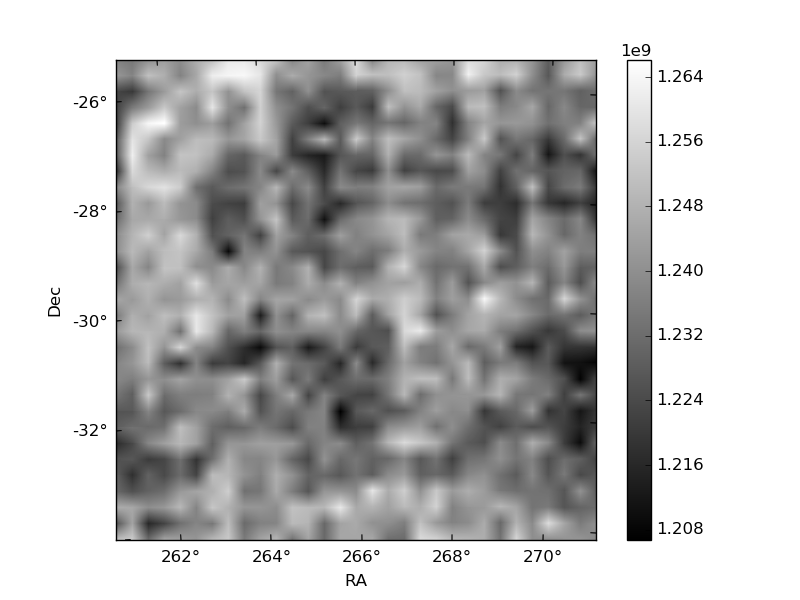
Histogram calculated using DETX and DETY for each event in the final _common_clean file
| Quadrant A |  |
 |
Quadrant B |
|---|---|---|---|
| Quadrant D |  |
 |
Quadrant C |
| Plot type | Count rate plots | Images |
|---|---|---|
| Comparison with Poisson distribution Blue bars denote a histogram of data divided into 1 sec bins. Red curve is a Poisson curve with rate = median count rate of data. |
 |
 |
| Quadrant-wise count rates Data is divided into 100 sec bins |
 |
|
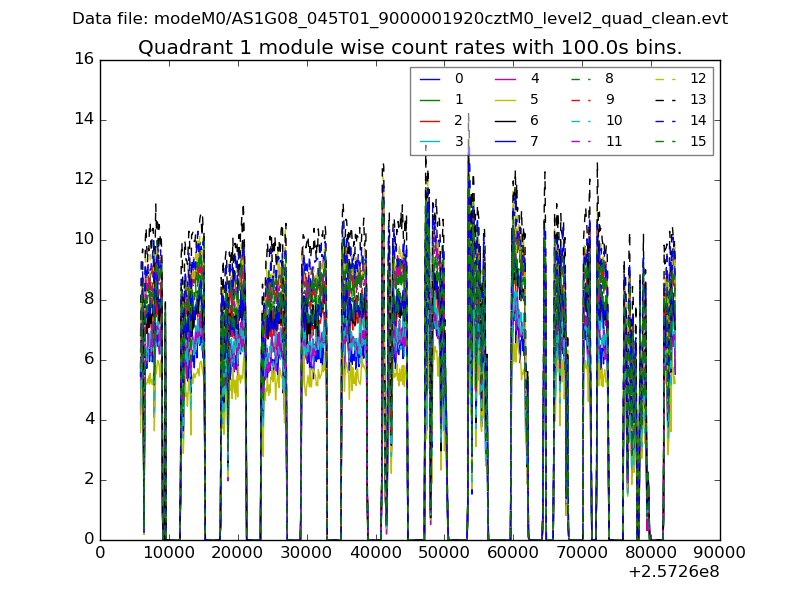
| Module-wise count rates for Quadrant A Data is divided into 100 sec bins |
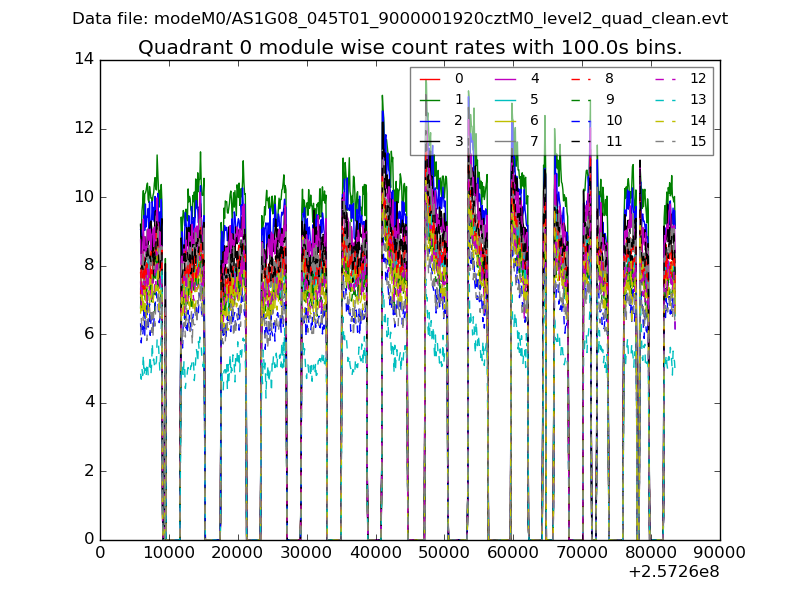 |
 |
| Module-wise count rates for Quadrant B Data is divided into 100 sec bins |
 |
 |
| Module-wise count rates for Quadrant C Data is divided into 100 sec bins |
 |
 |
| Module-wise count rates for Quadrant D Data is divided into 100 sec bins |
 |
 |
| Parameter | Plot |
|---|---|
| CZT HV Monitor |  |
| D_VDD |  |
| Temperature 1 |  |
| Veto HV Monitor |  |
| Veto LLD |  |
| Alpha Counter |  |
| _CPM_Rate |  |
| CZT Counter |  |
| +2.5 Volts monitor |  |
| +5 Volts monitor |  |
| _ROLL_ROT |  |
| _Roll_DEC |  |
| _Roll_RA |  |
| Veto Counter | 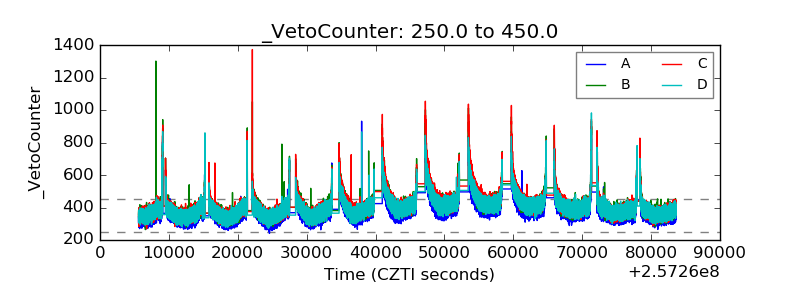 |