| Param | Original file | Final file |
|---|---|---|
| Filename | modeM0/AS1A04_149T01_9000001918cztM0_level2_bc.evt | modeM0/AS1A04_149T01_9000001918cztM0_level2_quad_clean.evt |
| Size (bytes) | 5,068,560,960 | 1,625,135,040 |
| Size | 4.7 GB | 1.5 GB |
| Events in quadrant A | 29,482,283 | 10,727,281 |
| Events in quadrant B | 49,945,198 | 9,400,850 |
| Events in quadrant C | 23,940,393 | 10,838,909 |
| Events in quadrant D | 42,017,847 | 10,090,883 |
| Mode M0 | |||
|---|---|---|---|
| Quadrant | BADHDUFLAG | Total packets | Discarded packets |
| A | 0 | 259730 | 0 |
| B | 0 | 390566 | 0 |
| C | 0 | 244021 | 0 |
| D | 0 | 303474 | 0 |
| Mode M9 | |||
|---|---|---|---|
| Quadrant | BADHDUFLAG | Total packets | Discarded packets |
| A | 0 | 193 | 0 |
| B | 0 | 193 | 0 |
| C | 0 | 193 | 0 |
| D | 0 | 193 | 0 |
| Mode SS | |||
|---|---|---|---|
| Quadrant | BADHDUFLAG | Total packets | Discarded packets |
| A | 0 | 2428 | 0 |
| B | 0 | 2428 | 0 |
| C | 0 | 2428 | 0 |
| D | 0 | 2428 | 0 |
| Quadrant | Total seconds | Saturated seconds | Saturation percentage |
|---|---|---|---|
| A | 119071 | 1982 | 1.664553% |
| B | 119071 | 24477 | 20.556643% |
| C | 119071 | 1224 | 1.027958% |
| D | 119071 | 5067 | 4.255444% |
Noise dominated data is calculated using 1-second bins in cleaned event files. If a bin has >2000 counts, and if more than 50% of those come from <1% of pixels, then it is considered to be noise-dominated and hence unusable.
| Quadrant | # 1 sec bins | Bins with >0 counts | Bins with >2000 counts | High rate bins dominated by noise | Noise dominated (total time) | Noise dominated (detector-on time) | Marked lightcurve |
|---|---|---|---|---|---|---|---|
| A | 138378 | 119075 | 60 | 60 | 0.04% | 0.05% | 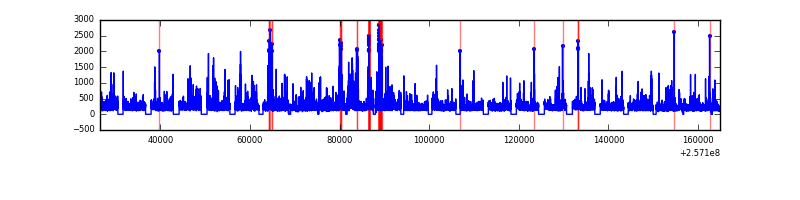 |
| B | 138378 | 118481 | 1746 | 1746 | 1.26% | 1.47% |  |
| C | 138378 | 119073 | 2 | 2 | 0.00% | 0.00% |  |
| D | 138378 | 119058 | 1030 | 1030 | 0.74% | 0.87% |  |
Top three noisy pixels from each quadrant. If the there are fewer than three noisy pixels in the level2.evt file, extra rows are filled as -1
| Pixel properties | Quadrant properties | ||||||
|---|---|---|---|---|---|---|---|
| Quadrant | DetID | PixID | Counts | Sigma | Mean | Median | Sigma |
| A | 8 | 15 | 2513657 | 1911.15 | 6071 | 5953 | 1312.1 |
| A | 12 | 189 | 2027105 | 1540.35 | 6071 | 5953 | 1312.1 |
| A | 15 | 223 | 511202 | 385.06 | 6071 | 5953 | 1312.1 |
| B | 4 | 239 | 21514982 | 21251.34 | 5371 | 5237 | 1012.2 |
| B | 3 | 64 | 3076825 | 3034.69 | 5371 | 5237 | 1012.2 |
| B | 0 | 85 | 2525236 | 2489.72 | 5371 | 5237 | 1012.2 |
| C | 14 | 234 | 69625 | 47.74 | 6075 | 6002 | 1332.6 |
| C | 12 | 4 | 47301 | 30.99 | 6075 | 6002 | 1332.6 |
| C | 8 | 222 | 45048 | 29.3 | 6075 | 6002 | 1332.6 |
| D | 1 | 52 | 13969225 | 10095.73 | 5940 | 5736 | 1383.1 |
| D | 8 | 195 | 3422952 | 2470.68 | 5940 | 5736 | 1383.1 |
| D | 14 | 34 | 1188509 | 855.16 | 5940 | 5736 | 1383.1 |
Histogram calculated using DETX and DETY for each event in the final _common_clean file
| Quadrant A | 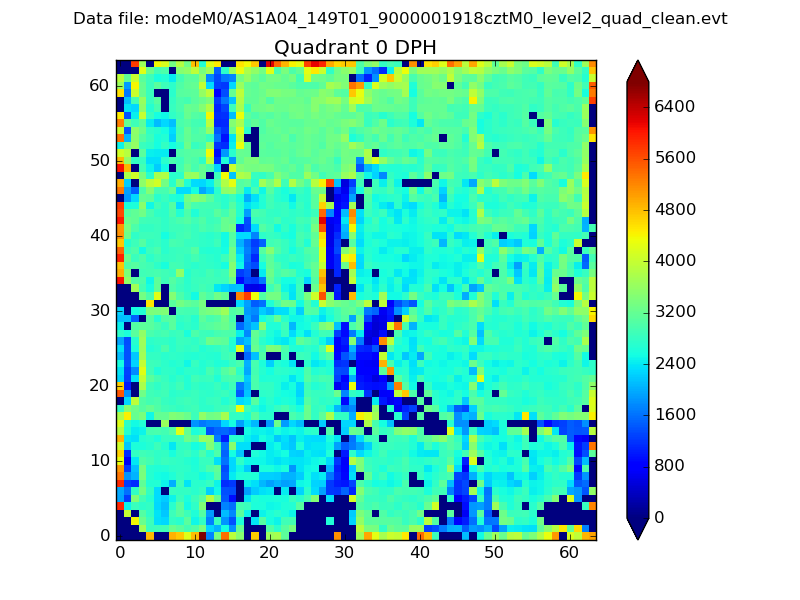 |
 |
Quadrant B |
|---|---|---|---|
| Quadrant D |  |
 |
Quadrant C |
| Plot type | Count rate plots | Images |
|---|---|---|
| Comparison with Poisson distribution Blue bars denote a histogram of data divided into 1 sec bins. Red curve is a Poisson curve with rate = median count rate of data. |
 |
 |
| Quadrant-wise count rates Data is divided into 100 sec bins |
 |
|
| Module-wise count rates for Quadrant A Data is divided into 100 sec bins |
 |
 |
| Module-wise count rates for Quadrant B Data is divided into 100 sec bins |
 |
 |
| Module-wise count rates for Quadrant C Data is divided into 100 sec bins |
 |
 |
| Module-wise count rates for Quadrant D Data is divided into 100 sec bins |
 |
 |
| Parameter | Plot |
|---|---|
| CZT HV Monitor |  |
| D_VDD |  |
| Temperature 1 |  |
| Veto HV Monitor |  |
| Veto LLD | 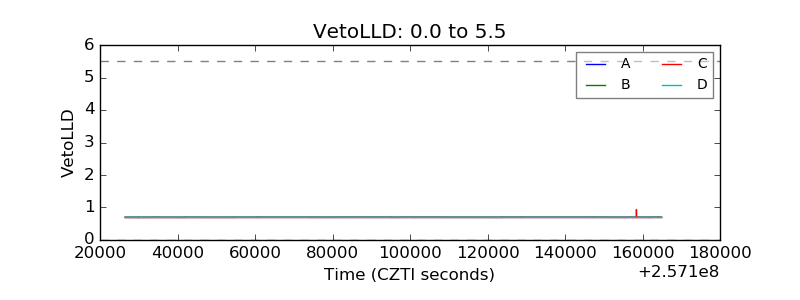 |
| Alpha Counter |  |
| _CPM_Rate | 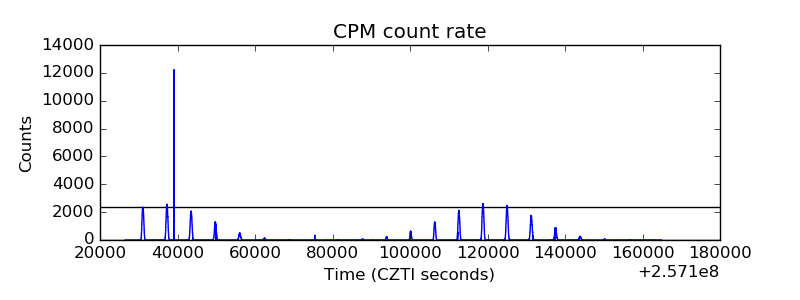 |
| CZT Counter |  |
| +2.5 Volts monitor |  |
| +5 Volts monitor |  |
| _ROLL_ROT |  |
| _Roll_DEC |  |
| _Roll_RA |  |
| Veto Counter | 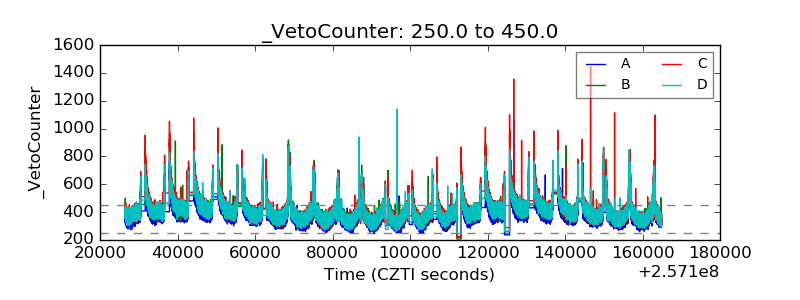 |