| Param | Original file | Final file |
|---|---|---|
| Filename | modeM0/AS1A04_216T01_9000001916cztM0_level2_bc.evt | modeM0/AS1A04_216T01_9000001916cztM0_level2_quad_clean.evt |
| Size (bytes) | 6,594,641,280 | 2,057,685,120 |
| Size | 6.1 GB | 1.9 GB |
| Events in quadrant A | 38,951,603 | 13,482,301 |
| Events in quadrant B | 63,719,289 | 11,606,082 |
| Events in quadrant C | 31,456,765 | 13,606,675 |
| Events in quadrant D | 54,791,435 | 12,764,254 |
| Mode M9 | |||
|---|---|---|---|
| Quadrant | BADHDUFLAG | Total packets | Discarded packets |
| A | 0 | 236 | 0 |
| B | 0 | 236 | 0 |
| C | 0 | 236 | 0 |
| D | 0 | 236 | 0 |
| Mode SS | |||
|---|---|---|---|
| Quadrant | BADHDUFLAG | Total packets | Discarded packets |
| A | 0 | 3228 | 0 |
| B | 0 | 3228 | 0 |
| C | 0 | 3228 | 0 |
| D | 0 | 3228 | 0 |
| Mode M0 | |||
|---|---|---|---|
| Quadrant | BADHDUFLAG | Total packets | Discarded packets |
| A | 0 | 346507 | 0 |
| B | 0 | 506227 | 0 |
| C | 0 | 324244 | 0 |
| D | 0 | 401349 | 0 |
| Quadrant | Total seconds | Saturated seconds | Saturation percentage |
|---|---|---|---|
| A | 158489 | 2723 | 1.718100% |
| B | 158489 | 30412 | 19.188713% |
| C | 158489 | 1428 | 0.901009% |
| D | 158489 | 6443 | 4.065266% |
Noise dominated data is calculated using 1-second bins in cleaned event files. If a bin has >2000 counts, and if more than 50% of those come from <1% of pixels, then it is considered to be noise-dominated and hence unusable.
| Quadrant | # 1 sec bins | Bins with >0 counts | Bins with >2000 counts | High rate bins dominated by noise | Noise dominated (total time) | Noise dominated (detector-on time) | Marked lightcurve |
|---|---|---|---|---|---|---|---|
| A | 182010 | 158490 | 68 | 68 | 0.04% | 0.04% |  |
| B | 182010 | 157838 | 2205 | 2205 | 1.21% | 1.40% |  |
| C | 182010 | 158490 | 2 | 2 | 0.00% | 0.00% |  |
| D | 182010 | 158475 | 1344 | 1344 | 0.74% | 0.85% | 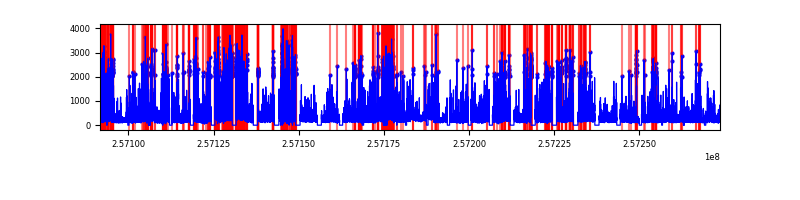 |
Top three noisy pixels from each quadrant. If the there are fewer than three noisy pixels in the level2.evt file, extra rows are filled as -1
| Pixel properties | Quadrant properties | ||||||
|---|---|---|---|---|---|---|---|
| Quadrant | DetID | PixID | Counts | Sigma | Mean | Median | Sigma |
| A | 12 | 189 | 2784218 | 1594.18 | 7984 | 7829 | 1741.6 |
| A | 8 | 15 | 2689263 | 1539.66 | 7984 | 7829 | 1741.6 |
| A | 15 | 223 | 1048594 | 597.6 | 7984 | 7829 | 1741.6 |
| B | 4 | 239 | 27187657 | 20244.62 | 7104 | 6916 | 1342.6 |
| B | 3 | 64 | 3719719 | 2765.35 | 7104 | 6916 | 1342.6 |
| B | 0 | 85 | 2694431 | 2001.7 | 7104 | 6916 | 1342.6 |
| C | 14 | 234 | 143463 | 77.31 | 7965 | 7867 | 1753.9 |
| C | 12 | 4 | 66931 | 33.68 | 7965 | 7867 | 1753.9 |
| C | 8 | 222 | 57802 | 28.47 | 7965 | 7867 | 1753.9 |
| D | 1 | 52 | 18639821 | 10130.85 | 7814 | 7534 | 1839.2 |
| D | 8 | 195 | 4071272 | 2209.56 | 7814 | 7534 | 1839.2 |
| D | 14 | 34 | 1300165 | 702.84 | 7814 | 7534 | 1839.2 |
Histogram calculated using DETX and DETY for each event in the final _common_clean file
| Quadrant A | 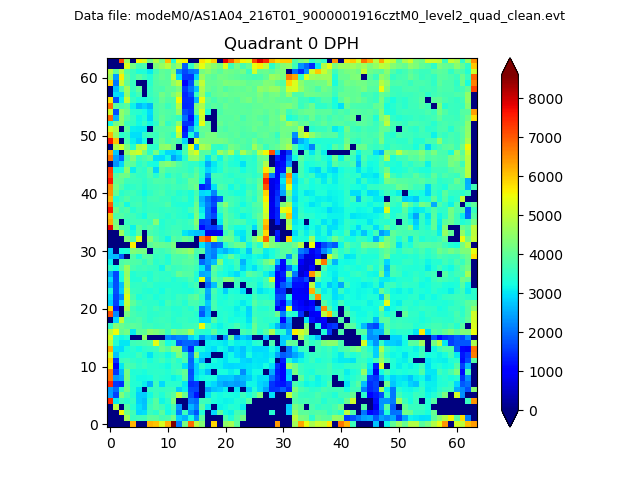 |
 |
Quadrant B |
|---|---|---|---|
| Quadrant D |  |
 |
Quadrant C |
| Plot type | Count rate plots | Images |
|---|---|---|
| Comparison with Poisson distribution Blue bars denote a histogram of data divided into 1 sec bins. Red curve is a Poisson curve with rate = median count rate of data. |
 |
 |
| Quadrant-wise count rates Data is divided into 100 sec bins |
 |
|
| Module-wise count rates for Quadrant A Data is divided into 100 sec bins |
 |
 |
| Module-wise count rates for Quadrant B Data is divided into 100 sec bins |
 |
 |
| Module-wise count rates for Quadrant C Data is divided into 100 sec bins |
 |
 |
| Module-wise count rates for Quadrant D Data is divided into 100 sec bins |
 |
 |
| Parameter | Plot |
|---|---|
| CZT HV Monitor |  |
| D_VDD |  |
| Temperature 1 | 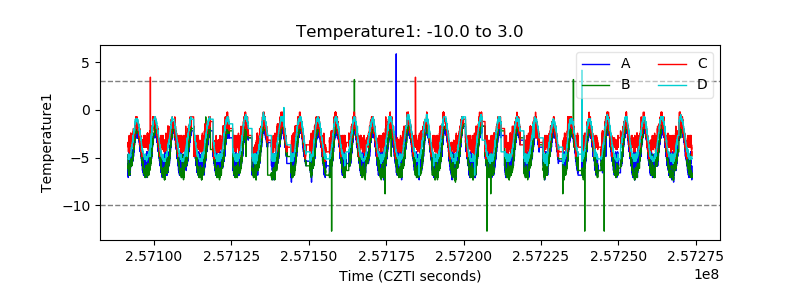 |
| Veto HV Monitor |  |
| Veto LLD | 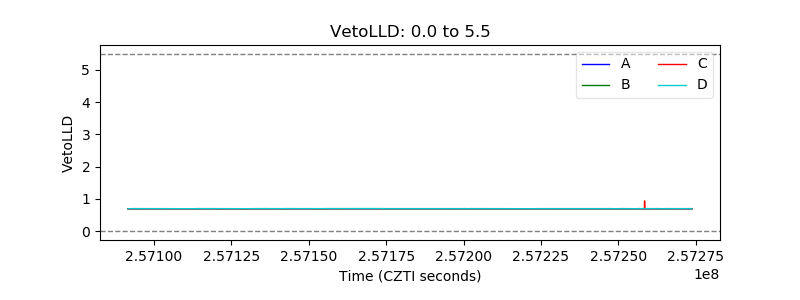 |
| Alpha Counter |  |
| _CPM_Rate |  |
| CZT Counter |  |
| +2.5 Volts monitor | 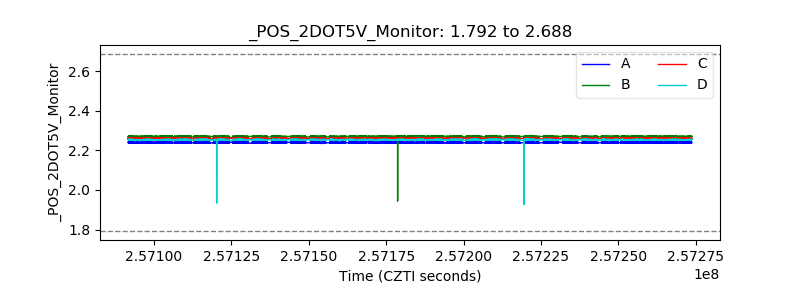 |
| +5 Volts monitor |  |
| _ROLL_ROT |  |
| _Roll_DEC | 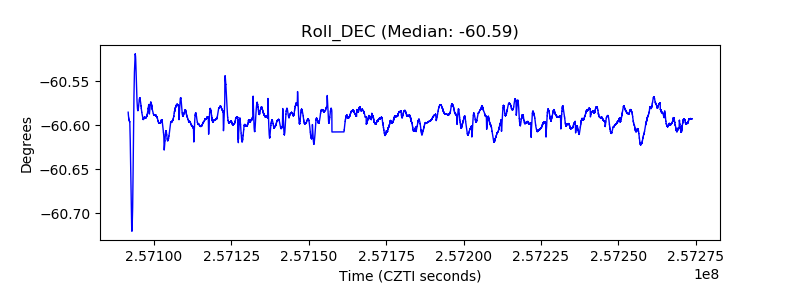 |
| _Roll_RA |  |
| Veto Counter |  |