| Param | Original file | Final file |
|---|---|---|
| Filename | modeM0/AS1T02_002T01_9000001914cztM0_level2_bc.evt | modeM0/AS1T02_002T01_9000001914cztM0_level2_quad_clean.evt |
| Size (bytes) | 2,482,528,320 | 1,124,225,280 |
| Size | 2.3 GB | 1.0 GB |
| Events in quadrant A | 14,713,766 | 7,755,219 |
| Events in quadrant B | 23,869,831 | 6,877,166 |
| Events in quadrant C | 12,394,993 | 7,834,287 |
| Events in quadrant D | 20,003,830 | 7,361,374 |
| Mode SS | |||
|---|---|---|---|
| Quadrant | BADHDUFLAG | Total packets | Discarded packets |
| A | 0 | 1252 | 0 |
| B | 0 | 1252 | 0 |
| C | 0 | 1252 | 0 |
| D | 0 | 1252 | 0 |
| Mode M9 | |||
|---|---|---|---|
| Quadrant | BADHDUFLAG | Total packets | Discarded packets |
| A | 0 | 113 | 0 |
| B | 0 | 113 | 0 |
| C | 0 | 113 | 0 |
| D | 0 | 113 | 0 |
| Mode M0 | |||
|---|---|---|---|
| Quadrant | BADHDUFLAG | Total packets | Discarded packets |
| A | 0 | 134315 | 0 |
| B | 0 | 195022 | 0 |
| C | 0 | 126040 | 0 |
| D | 0 | 152021 | 0 |
| Quadrant | Total seconds | Saturated seconds | Saturation percentage |
|---|---|---|---|
| A | 61570 | 916 | 1.487738% |
| B | 61570 | 11484 | 18.651941% |
| C | 61570 | 297 | 0.482378% |
| D | 61570 | 2389 | 3.880136% |
Noise dominated data is calculated using 1-second bins in cleaned event files. If a bin has >2000 counts, and if more than 50% of those come from <1% of pixels, then it is considered to be noise-dominated and hence unusable.
| Quadrant | # 1 sec bins | Bins with >0 counts | Bins with >2000 counts | High rate bins dominated by noise | Noise dominated (total time) | Noise dominated (detector-on time) | Marked lightcurve |
|---|---|---|---|---|---|---|---|
| A | 72717 | 61573 | 25 | 25 | 0.03% | 0.04% |  |
| B | 72716 | 61226 | 523 | 523 | 0.72% | 0.85% | 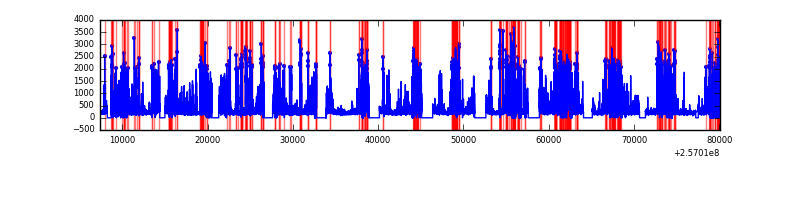 |
| C | 72717 | 61574 | 8 | 8 | 0.01% | 0.01% |  |
| D | 72717 | 61570 | 429 | 429 | 0.59% | 0.70% | 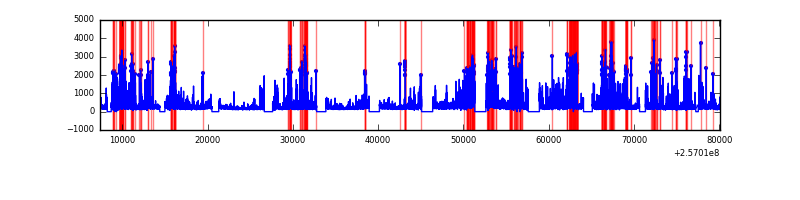 |
Top three noisy pixels from each quadrant. If the there are fewer than three noisy pixels in the level2.evt file, extra rows are filled as -1
| Pixel properties | Quadrant properties | ||||||
|---|---|---|---|---|---|---|---|
| Quadrant | DetID | PixID | Counts | Sigma | Mean | Median | Sigma |
| A | 12 | 189 | 1123703 | 1656.61 | 3111 | 3059 | 676.5 |
| A | 15 | 223 | 609624 | 896.67 | 3111 | 3059 | 676.5 |
| A | 13 | 248 | 302277 | 442.33 | 3111 | 3059 | 676.5 |
| B | 4 | 239 | 10279067 | 19371.01 | 2757 | 2684 | 530.5 |
| B | 3 | 64 | 1251213 | 2353.48 | 2757 | 2684 | 530.5 |
| B | 0 | 219 | 350730 | 656.07 | 2757 | 2684 | 530.5 |
| C | 0 | 207 | 269353 | 393.34 | 3075 | 3039 | 677.1 |
| C | 14 | 234 | 76780 | 108.91 | 3075 | 3039 | 677.1 |
| C | 12 | 4 | 19629 | 24.5 | 3075 | 3039 | 677.1 |
| D | 1 | 52 | 7639661 | 10822.87 | 3040 | 2942 | 705.6 |
| D | 8 | 195 | 329347 | 462.59 | 3040 | 2942 | 705.6 |
| D | 2 | 234 | 209033 | 292.08 | 3040 | 2942 | 705.6 |
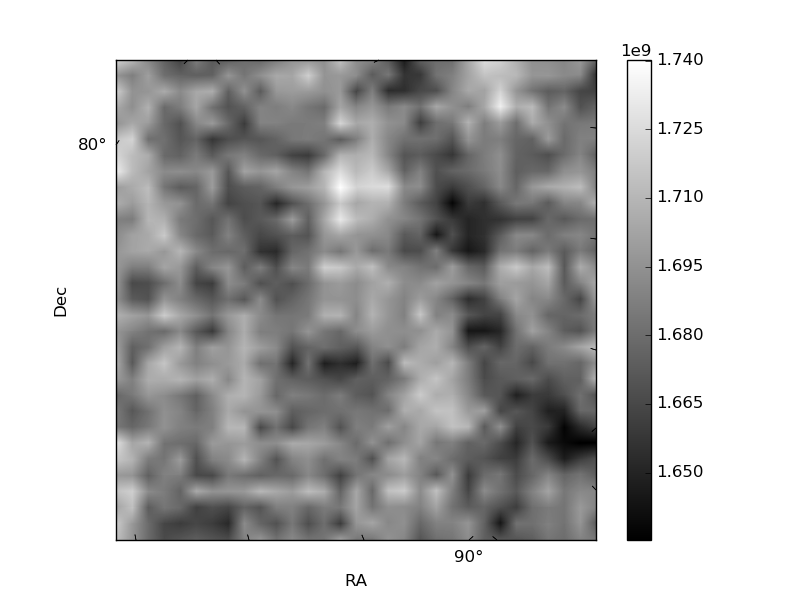
Histogram calculated using DETX and DETY for each event in the final _common_clean file
| Quadrant A |  |
 |
Quadrant B |
|---|---|---|---|
| Quadrant D |  |
 |
Quadrant C |
| Plot type | Count rate plots | Images |
|---|---|---|
| Comparison with Poisson distribution Blue bars denote a histogram of data divided into 1 sec bins. Red curve is a Poisson curve with rate = median count rate of data. |
 |
 |
| Quadrant-wise count rates Data is divided into 100 sec bins |
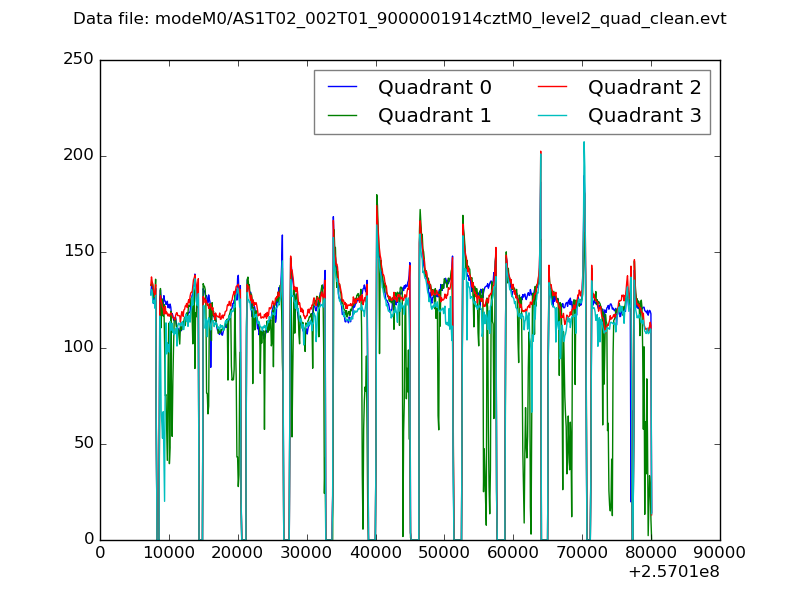 |
|
| Module-wise count rates for Quadrant A Data is divided into 100 sec bins |
 |
 |
| Module-wise count rates for Quadrant B Data is divided into 100 sec bins |
 |
 |
| Module-wise count rates for Quadrant C Data is divided into 100 sec bins |
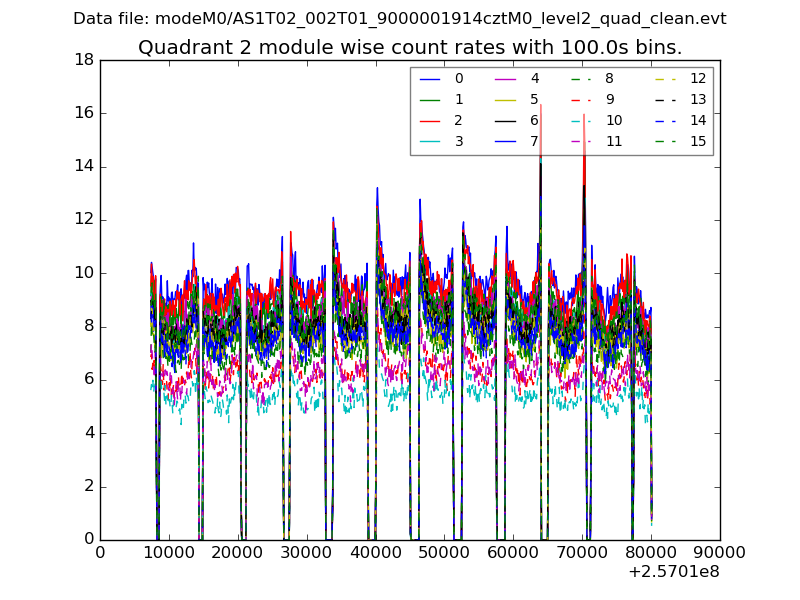 |
 |
| Module-wise count rates for Quadrant D Data is divided into 100 sec bins |
 |
 |
| Parameter | Plot |
|---|---|
| CZT HV Monitor |  |
| D_VDD |  |
| Temperature 1 |  |
| Veto HV Monitor |  |
| Veto LLD |  |
| Alpha Counter |  |
| _CPM_Rate |  |
| CZT Counter |  |
| +2.5 Volts monitor |  |
| +5 Volts monitor |  |
| _ROLL_ROT |  |
| _Roll_DEC |  |
| _Roll_RA |  |
| Veto Counter | 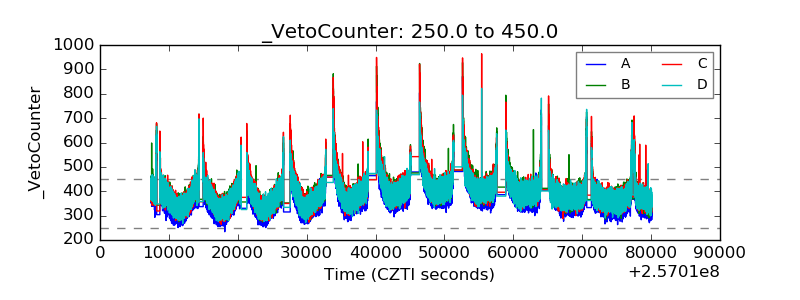 |