| Param | Original file | Final file |
|---|---|---|
| Filename | modeM0/AS1G08_055T01_9000001912cztM0_level2_bc.evt | modeM0/AS1G08_055T01_9000001912cztM0_level2_quad_clean.evt |
| Size (bytes) | 4,719,242,880 | 1,568,520,000 |
| Size | 4.4 GB | 1.5 GB |
| Events in quadrant A | 26,975,240 | 10,190,771 |
| Events in quadrant B | 46,603,646 | 9,542,134 |
| Events in quadrant C | 23,323,631 | 10,261,179 |
| Events in quadrant D | 38,238,488 | 9,683,113 |
| Mode M9 | |||
|---|---|---|---|
| Quadrant | BADHDUFLAG | Total packets | Discarded packets |
| A | 0 | 179 | 0 |
| B | 0 | 179 | 0 |
| C | 0 | 179 | 0 |
| D | 0 | 179 | 0 |
| Mode M0 | |||
|---|---|---|---|
| Quadrant | BADHDUFLAG | Total packets | Discarded packets |
| A | 0 | 244984 | 0 |
| B | 0 | 341474 | 0 |
| C | 0 | 235255 | 0 |
| D | 0 | 282959 | 0 |
| Mode SS | |||
|---|---|---|---|
| Quadrant | BADHDUFLAG | Total packets | Discarded packets |
| A | 0 | 2328 | 0 |
| B | 0 | 2328 | 0 |
| C | 0 | 2328 | 0 |
| D | 0 | 2328 | 0 |
| Quadrant | Total seconds | Saturated seconds | Saturation percentage |
|---|---|---|---|
| A | 114246 | 1563 | 1.368100% |
| B | 114246 | 15269 | 13.365019% |
| C | 114246 | 1029 | 0.900688% |
| D | 114246 | 3536 | 3.095076% |
Noise dominated data is calculated using 1-second bins in cleaned event files. If a bin has >2000 counts, and if more than 50% of those come from <1% of pixels, then it is considered to be noise-dominated and hence unusable.
| Quadrant | # 1 sec bins | Bins with >0 counts | Bins with >2000 counts | High rate bins dominated by noise | Noise dominated (total time) | Noise dominated (detector-on time) | Marked lightcurve |
|---|---|---|---|---|---|---|---|
| A | 132228 | 114253 | 10 | 10 | 0.01% | 0.01% | 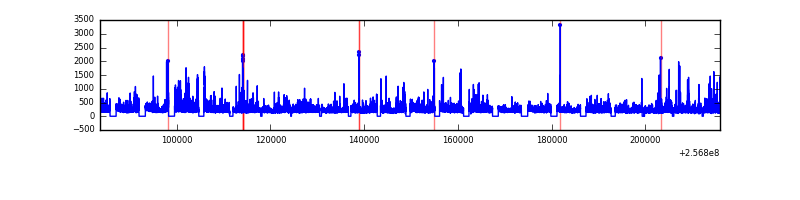 |
| B | 132228 | 113486 | 833 | 833 | 0.63% | 0.73% |  |
| C | 132228 | 114249 | 8 | 8 | 0.01% | 0.01% |  |
| D | 132228 | 114246 | 799 | 799 | 0.60% | 0.70% |  |
Top three noisy pixels from each quadrant. If the there are fewer than three noisy pixels in the level2.evt file, extra rows are filled as -1
| Pixel properties | Quadrant properties | ||||||
|---|---|---|---|---|---|---|---|
| Quadrant | DetID | PixID | Counts | Sigma | Mean | Median | Sigma |
| A | 12 | 189 | 2413358 | 1892.08 | 5899 | 5784 | 1272.4 |
| A | 8 | 15 | 640303 | 498.66 | 5899 | 5784 | 1272.4 |
| A | 1 | 162 | 413360 | 320.31 | 5899 | 5784 | 1272.4 |
| B | 0 | 85 | 8902760 | 8595.15 | 5533 | 5390 | 1035.2 |
| B | 4 | 239 | 8690713 | 8390.3 | 5533 | 5390 | 1035.2 |
| B | 3 | 64 | 3723363 | 3591.68 | 5533 | 5390 | 1035.2 |
| C | 0 | 207 | 118475 | 86.73 | 5887 | 5827 | 1298.8 |
| C | 14 | 234 | 104235 | 75.77 | 5887 | 5827 | 1298.8 |
| C | 12 | 4 | 48120 | 32.56 | 5887 | 5827 | 1298.8 |
| D | 1 | 52 | 13541879 | 10093.13 | 5825 | 5625 | 1341.1 |
| D | 8 | 195 | 950213 | 704.32 | 5825 | 5625 | 1341.1 |
| D | 10 | 157 | 711536 | 526.35 | 5825 | 5625 | 1341.1 |
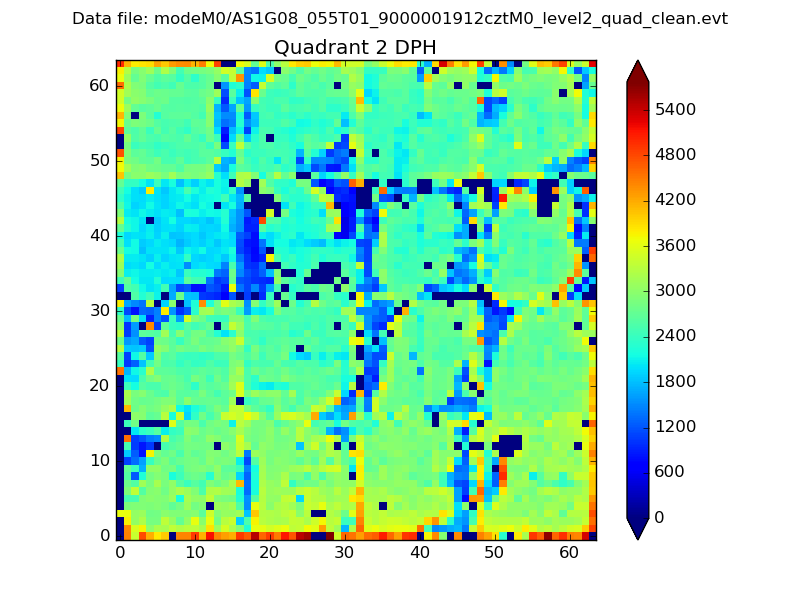
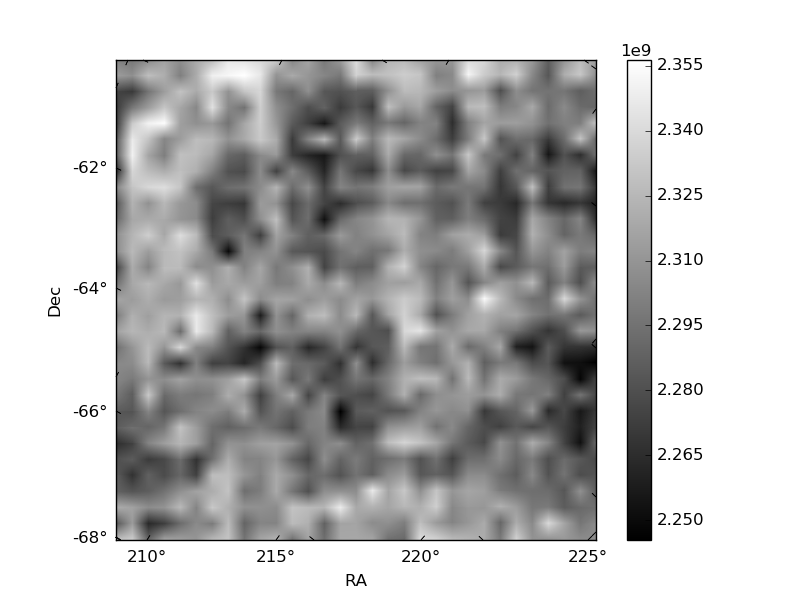
Histogram calculated using DETX and DETY for each event in the final _common_clean file
| Quadrant A |  |
 |
Quadrant B |
|---|---|---|---|
| Quadrant D | 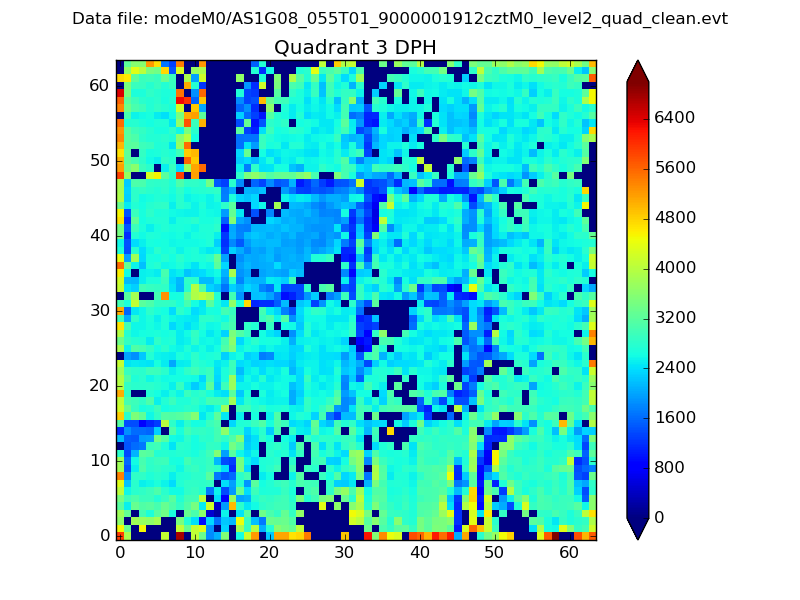 |
 |
Quadrant C |
| Plot type | Count rate plots | Images |
|---|---|---|
| Comparison with Poisson distribution Blue bars denote a histogram of data divided into 1 sec bins. Red curve is a Poisson curve with rate = median count rate of data. |
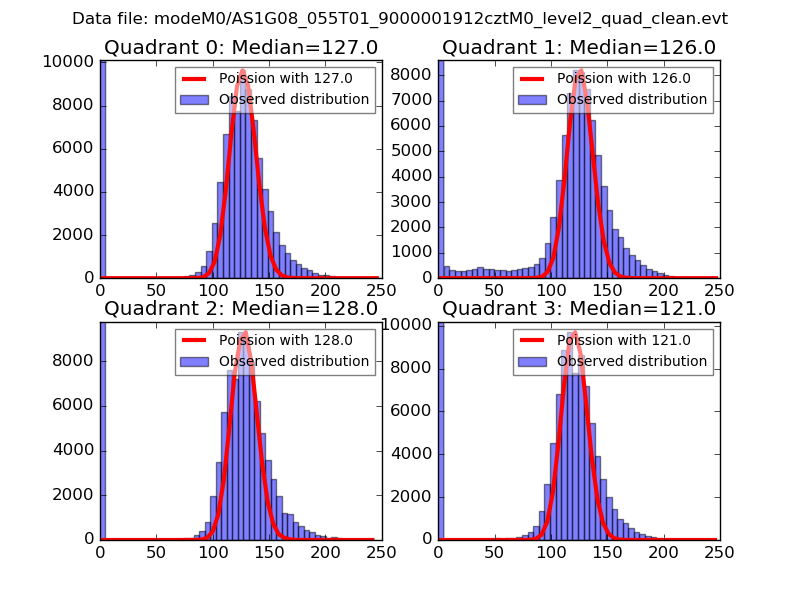 |
 |
| Quadrant-wise count rates Data is divided into 100 sec bins |
 |
|
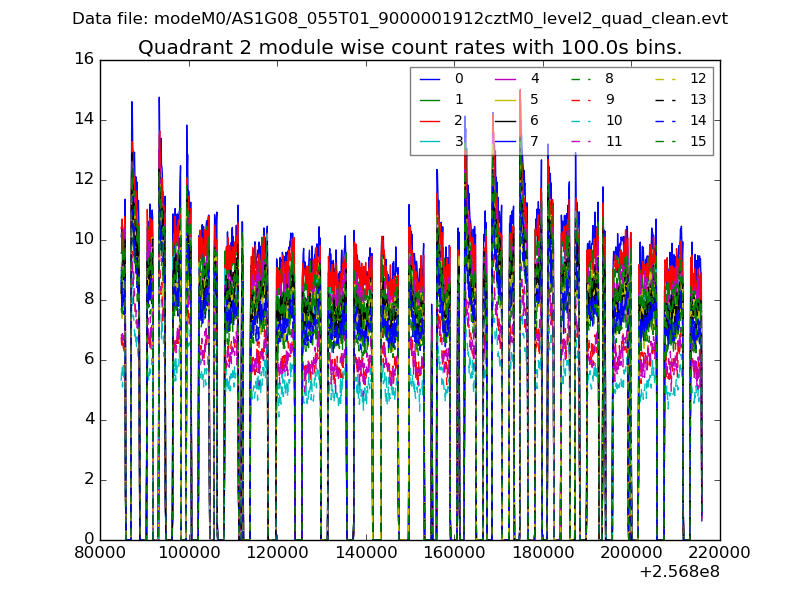
| Module-wise count rates for Quadrant A Data is divided into 100 sec bins |
 |
 |
| Module-wise count rates for Quadrant B Data is divided into 100 sec bins |
 |
 |
| Module-wise count rates for Quadrant C Data is divided into 100 sec bins |
 |
 |
| Module-wise count rates for Quadrant D Data is divided into 100 sec bins |
 |
 |
| Parameter | Plot |
|---|---|
| CZT HV Monitor |  |
| D_VDD | 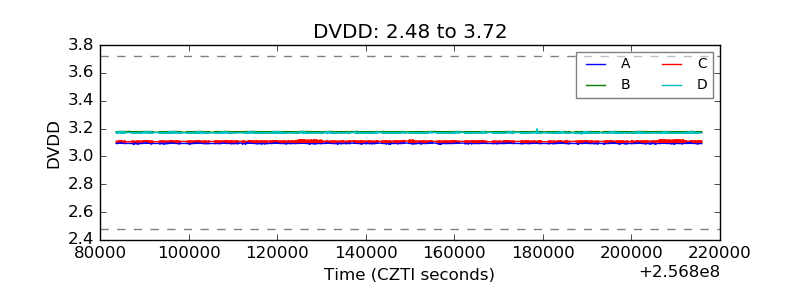 |
| Temperature 1 |  |
| Veto HV Monitor |  |
| Veto LLD |  |
| Alpha Counter |  |
| _CPM_Rate |  |
| CZT Counter |  |
| +2.5 Volts monitor |  |
| +5 Volts monitor |  |
| _ROLL_ROT |  |
| _Roll_DEC | 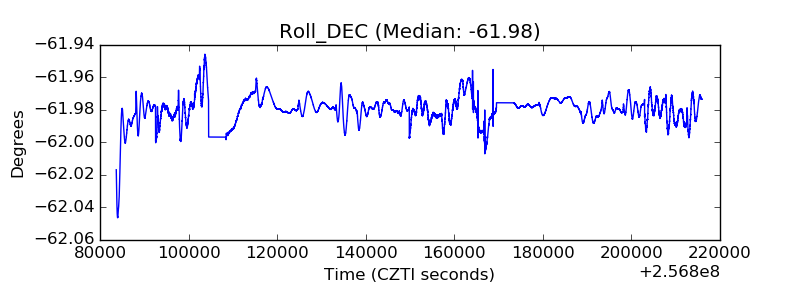 |
| _Roll_RA | 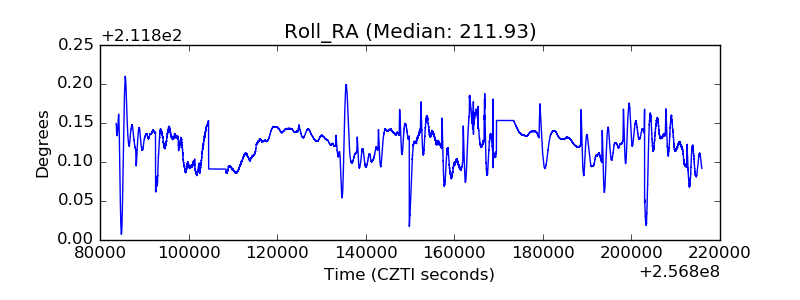 |
| Veto Counter |  |