| Param | Original file | Final file |
|---|---|---|
| Filename | modeM0/AS1T02_004T01_9000001910cztM0_level2_bc.evt | modeM0/AS1T02_004T01_9000001910cztM0_level2_quad_clean.evt |
| Size (bytes) | 1,282,645,440 | 440,130,240 |
| Size | 1.2 GB | 419.7 MB |
| Events in quadrant A | 7,823,093 | 2,842,374 |
| Events in quadrant B | 11,427,233 | 2,798,521 |
| Events in quadrant C | 6,399,517 | 2,863,484 |
| Events in quadrant D | 11,068,987 | 2,686,898 |
| Mode SS | |||
|---|---|---|---|
| Quadrant | BADHDUFLAG | Total packets | Discarded packets |
| A | 0 | 638 | 0 |
| B | 0 | 638 | 0 |
| C | 0 | 638 | 0 |
| D | 0 | 638 | 0 |
| Mode M9 | |||
|---|---|---|---|
| Quadrant | BADHDUFLAG | Total packets | Discarded packets |
| A | 0 | 49 | 0 |
| B | 0 | 49 | 0 |
| C | 0 | 49 | 0 |
| D | 0 | 49 | 0 |
| Mode M0 | |||
|---|---|---|---|
| Quadrant | BADHDUFLAG | Total packets | Discarded packets |
| A | 0 | 70292 | 0 |
| B | 0 | 87962 | 0 |
| C | 0 | 64125 | 0 |
| D | 0 | 78865 | 0 |
| Quadrant | Total seconds | Saturated seconds | Saturation percentage |
|---|---|---|---|
| A | 31128 | 458 | 1.471344% |
| B | 31128 | 2868 | 9.213570% |
| C | 31128 | 178 | 0.571832% |
| D | 31128 | 1228 | 3.945001% |
Noise dominated data is calculated using 1-second bins in cleaned event files. If a bin has >2000 counts, and if more than 50% of those come from <1% of pixels, then it is considered to be noise-dominated and hence unusable.
| Quadrant | # 1 sec bins | Bins with >0 counts | Bins with >2000 counts | High rate bins dominated by noise | Noise dominated (total time) | Noise dominated (detector-on time) | Marked lightcurve |
|---|---|---|---|---|---|---|---|
| A | 36235 | 31132 | 6 | 6 | 0.02% | 0.02% |  |
| B | 36235 | 31109 | 143 | 143 | 0.39% | 0.46% |  |
| C | 36235 | 31131 | 1 | 1 | 0.00% | 0.00% |  |
| D | 36235 | 31132 | 352 | 352 | 0.97% | 1.13% |  |
Top three noisy pixels from each quadrant. If the there are fewer than three noisy pixels in the level2.evt file, extra rows are filled as -1
| Pixel properties | Quadrant properties | ||||||
|---|---|---|---|---|---|---|---|
| Quadrant | DetID | PixID | Counts | Sigma | Mean | Median | Sigma |
| A | 12 | 189 | 803716 | 2289.69 | 1590 | 1559 | 350.3 |
| A | 15 | 223 | 299909 | 851.62 | 1590 | 1559 | 350.3 |
| A | 1 | 162 | 207851 | 588.84 | 1590 | 1559 | 350.3 |
| B | 0 | 85 | 2611479 | 8884.56 | 1544 | 1505 | 293.8 |
| B | 4 | 239 | 1587312 | 5398.21 | 1544 | 1505 | 293.8 |
| B | 3 | 64 | 776031 | 2636.55 | 1544 | 1505 | 293.8 |
| C | 14 | 234 | 141157 | 395.06 | 1584 | 1564 | 353.3 |
| C | 0 | 207 | 51061 | 140.08 | 1584 | 1564 | 353.3 |
| C | 13 | 61 | 9360 | 22.06 | 1584 | 1564 | 353.3 |
| D | 1 | 52 | 4050148 | 11118.88 | 1554 | 1501 | 364.1 |
| D | 8 | 195 | 662014 | 1813.98 | 1554 | 1501 | 364.1 |
| D | 2 | 14 | 184396 | 502.29 | 1554 | 1501 | 364.1 |
Histogram calculated using DETX and DETY for each event in the final _common_clean file
| Quadrant A |  |
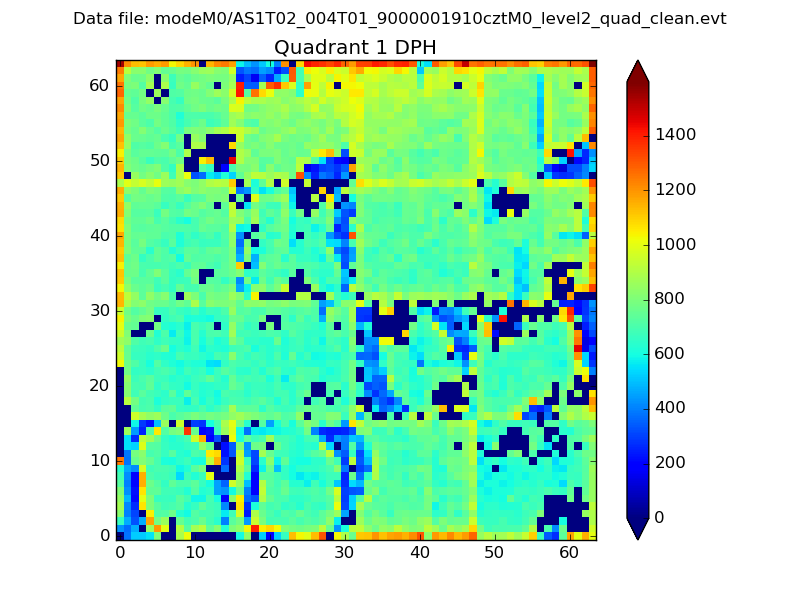 |
Quadrant B |
|---|---|---|---|
| Quadrant D |  |
 |
Quadrant C |
| Plot type | Count rate plots | Images |
|---|---|---|
| Comparison with Poisson distribution Blue bars denote a histogram of data divided into 1 sec bins. Red curve is a Poisson curve with rate = median count rate of data. |
 |
 |
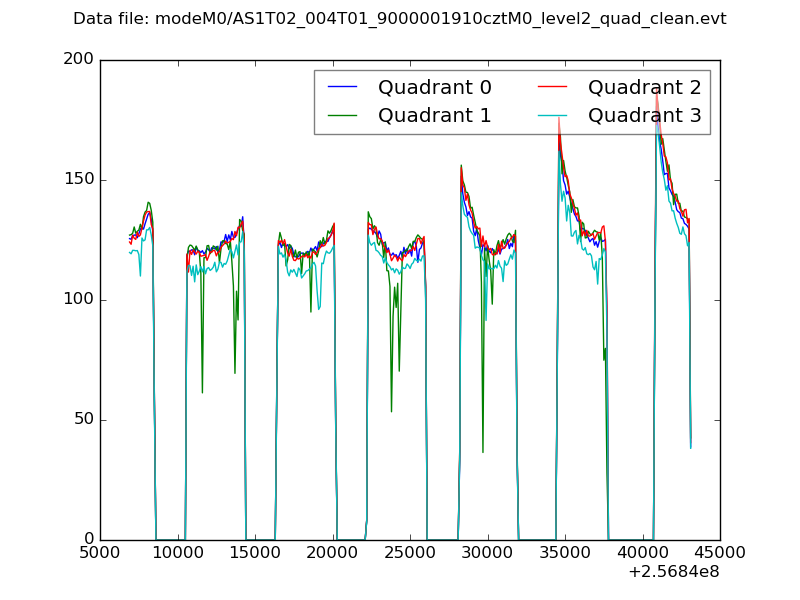
| Quadrant-wise count rates Data is divided into 100 sec bins |
 |
|
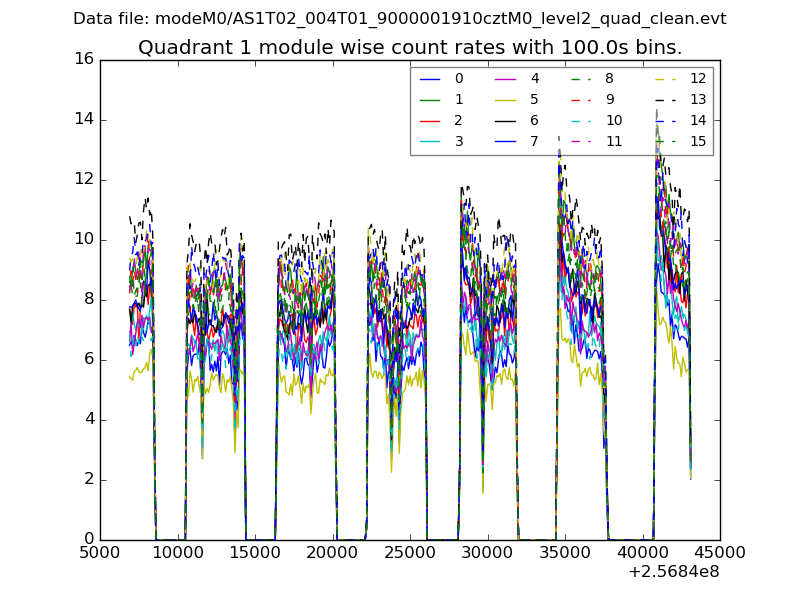
| Module-wise count rates for Quadrant A Data is divided into 100 sec bins |
 |
 |
| Module-wise count rates for Quadrant B Data is divided into 100 sec bins |
 |
 |
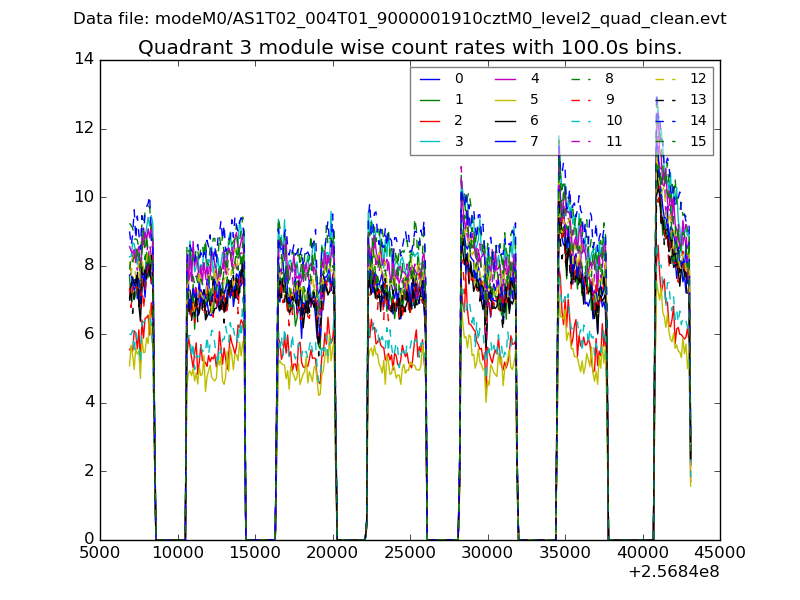
| Module-wise count rates for Quadrant C Data is divided into 100 sec bins |
 |
 |
| Module-wise count rates for Quadrant D Data is divided into 100 sec bins |
 |
 |
| Parameter | Plot |
|---|---|
| CZT HV Monitor | 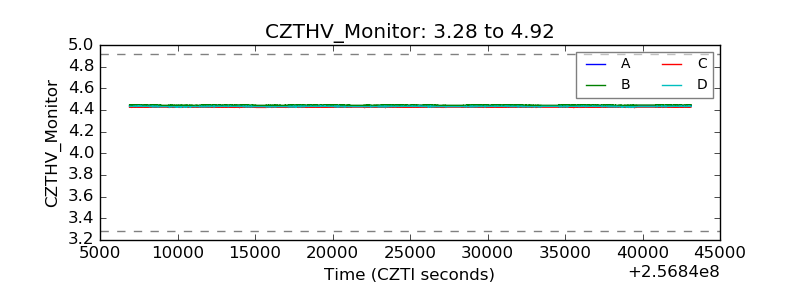 |
| D_VDD |  |
| Temperature 1 |  |
| Veto HV Monitor |  |
| Veto LLD |  |
| Alpha Counter | 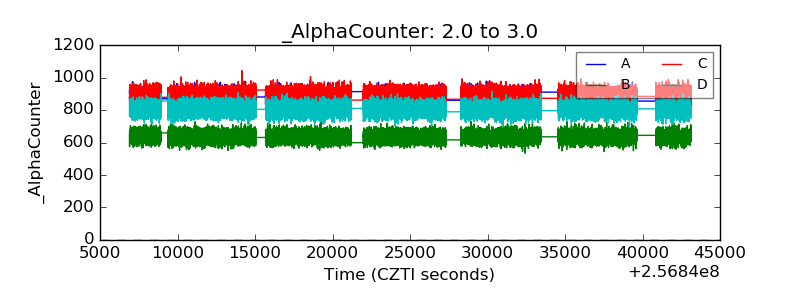 |
| _CPM_Rate | 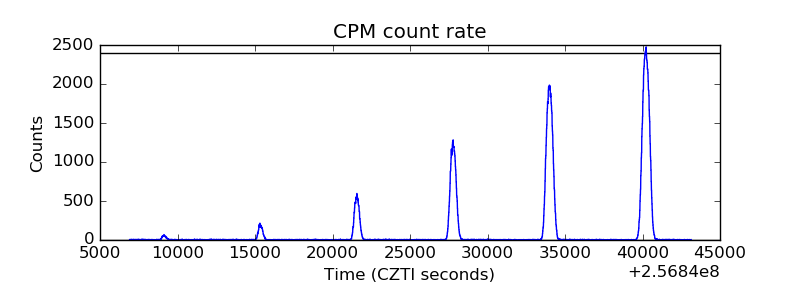 |
| CZT Counter | 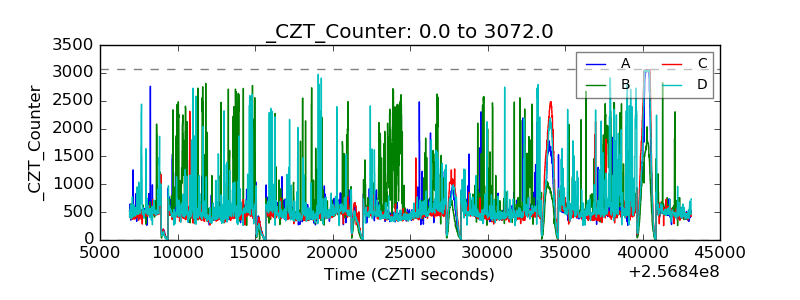 |
| +2.5 Volts monitor |  |
| +5 Volts monitor |  |
| _ROLL_ROT |  |
| _Roll_DEC |  |
| _Roll_RA |  |
| Veto Counter |  |