| Param | Original file | Final file |
|---|---|---|
| Filename | modeM0/AS1A04_112T01_9000001908cztM0_level2_bc.evt | modeM0/AS1A04_112T01_9000001908cztM0_level2_quad_clean.evt |
| Size (bytes) | 1,796,725,440 | 734,391,360 |
| Size | 1.7 GB | 700.4 MB |
| Events in quadrant A | 12,080,449 | 4,854,460 |
| Events in quadrant B | 13,434,669 | 4,608,181 |
| Events in quadrant C | 11,238,505 | 4,859,542 |
| Events in quadrant D | 14,446,350 | 4,688,728 |
| Mode SS | |||
|---|---|---|---|
| Quadrant | BADHDUFLAG | Total packets | Discarded packets |
| A | 0 | 960 | 0 |
| B | 0 | 960 | 0 |
| C | 0 | 960 | 0 |
| D | 0 | 960 | 0 |
| Mode M9 | |||
|---|---|---|---|
| Quadrant | BADHDUFLAG | Total packets | Discarded packets |
| A | 0 | 82 | 0 |
| B | 0 | 82 | 0 |
| C | 0 | 82 | 0 |
| D | 0 | 82 | 0 |
| Mode M0 | |||
|---|---|---|---|
| Quadrant | BADHDUFLAG | Total packets | Discarded packets |
| A | 0 | 105832 | 0 |
| B | 0 | 119531 | 0 |
| C | 0 | 102355 | 0 |
| D | 0 | 109939 | 0 |
| Quadrant | Total seconds | Saturated seconds | Saturation percentage |
|---|---|---|---|
| A | 47111 | 804 | 1.706608% |
| B | 47111 | 4177 | 8.866294% |
| C | 47111 | 1058 | 2.245760% |
| D | 47111 | 1031 | 2.188449% |
Noise dominated data is calculated using 1-second bins in cleaned event files. If a bin has >2000 counts, and if more than 50% of those come from <1% of pixels, then it is considered to be noise-dominated and hence unusable.
| Quadrant | # 1 sec bins | Bins with >0 counts | Bins with >2000 counts | High rate bins dominated by noise | Noise dominated (total time) | Noise dominated (detector-on time) | Marked lightcurve |
|---|---|---|---|---|---|---|---|
| A | 55227 | 47111 | 3 | 3 | 0.01% | 0.01% |  |
| B | 55227 | 46864 | 110 | 110 | 0.20% | 0.23% | 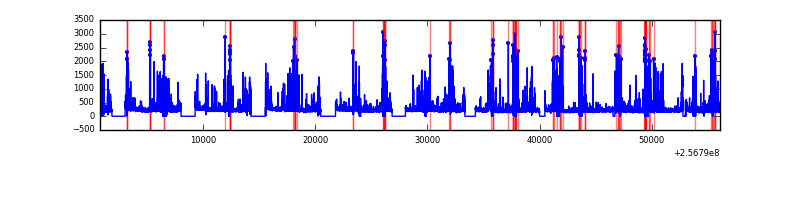 |
| C | 55227 | 47111 | 355 | 355 | 0.64% | 0.75% |  |
| D | 55227 | 47114 | 155 | 155 | 0.28% | 0.33% | 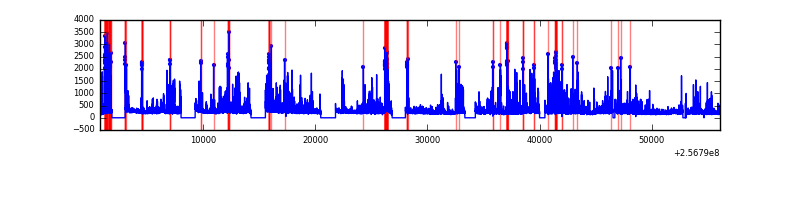 |
Top three noisy pixels from each quadrant. If the there are fewer than three noisy pixels in the level2.evt file, extra rows are filled as -1
| Pixel properties | Quadrant properties | ||||||
|---|---|---|---|---|---|---|---|
| Quadrant | DetID | PixID | Counts | Sigma | Mean | Median | Sigma |
| A | 12 | 189 | 1086027 | 2001.89 | 2514 | 2473 | 541.3 |
| A | 1 | 162 | 454111 | 834.41 | 2514 | 2473 | 541.3 |
| A | 15 | 223 | 299866 | 549.44 | 2514 | 2473 | 541.3 |
| B | 4 | 239 | 2477175 | 5508.82 | 2411 | 2359 | 449.2 |
| B | 3 | 64 | 732942 | 1626.24 | 2411 | 2359 | 449.2 |
| B | 0 | 219 | 265277 | 585.24 | 2411 | 2359 | 449.2 |
| C | 0 | 207 | 1557679 | 2903.67 | 2466 | 2448 | 535.6 |
| C | 14 | 234 | 15482 | 24.33 | 2466 | 2448 | 535.6 |
| C | 13 | 61 | 14988 | 23.41 | 2466 | 2448 | 535.6 |
| D | 1 | 52 | 2726846 | 4770.98 | 2489 | 2412 | 571.0 |
| D | 8 | 195 | 1274903 | 2228.36 | 2489 | 2412 | 571.0 |
| D | 2 | 14 | 347262 | 603.9 | 2489 | 2412 | 571.0 |
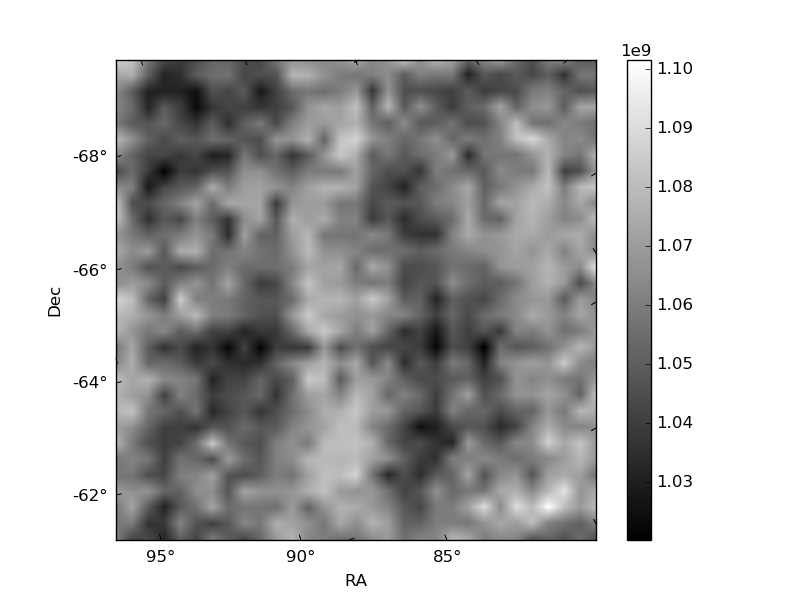
Histogram calculated using DETX and DETY for each event in the final _common_clean file
| Quadrant A |  |
 |
Quadrant B |
|---|---|---|---|
| Quadrant D |  |
 |
Quadrant C |
| Plot type | Count rate plots | Images |
|---|---|---|
| Comparison with Poisson distribution Blue bars denote a histogram of data divided into 1 sec bins. Red curve is a Poisson curve with rate = median count rate of data. |
 |
 |
| Quadrant-wise count rates Data is divided into 100 sec bins |
 |
|
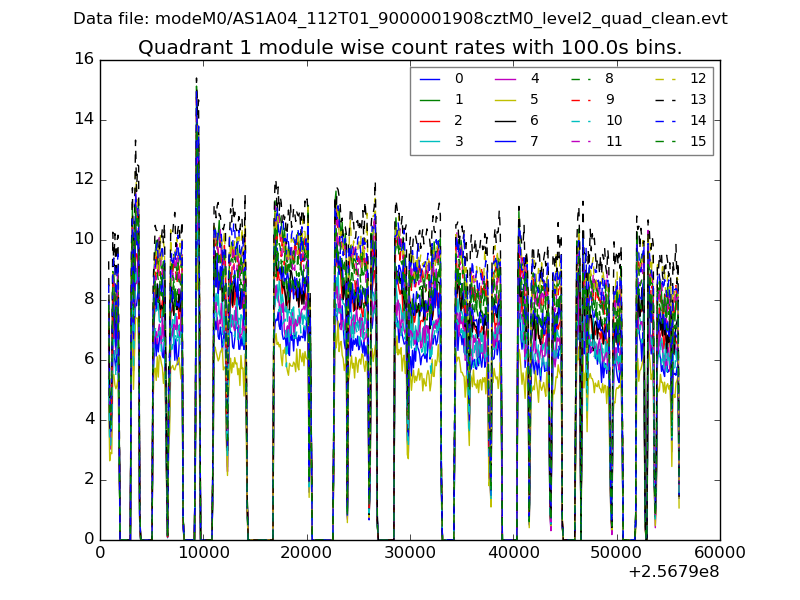
| Module-wise count rates for Quadrant A Data is divided into 100 sec bins |
 |
 |
| Module-wise count rates for Quadrant B Data is divided into 100 sec bins |
 |
 |
| Module-wise count rates for Quadrant C Data is divided into 100 sec bins |
 |
 |
| Module-wise count rates for Quadrant D Data is divided into 100 sec bins |
 |
 |
| Parameter | Plot |
|---|---|
| CZT HV Monitor |  |
| D_VDD |  |
| Temperature 1 |  |
| Veto HV Monitor | 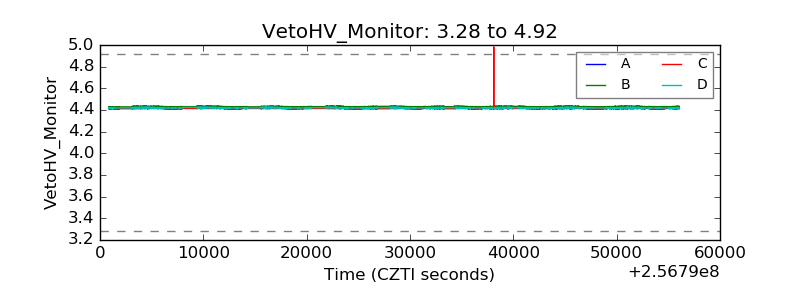 |
| Veto LLD | 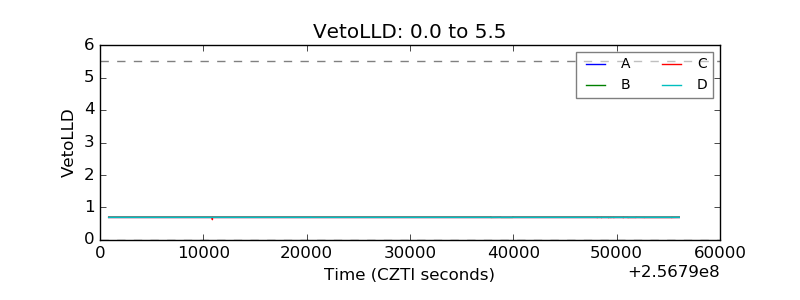 |
| Alpha Counter |  |
| _CPM_Rate |  |
| CZT Counter |  |
| +2.5 Volts monitor |  |
| +5 Volts monitor |  |
| _ROLL_ROT |  |
| _Roll_DEC |  |
| _Roll_RA |  |
| Veto Counter |  |