| Param | Original file | Final file |
|---|---|---|
| Filename | modeM0/AS1G08_035T01_9000001904cztM0_level2_bc.evt | modeM0/AS1G08_035T01_9000001904cztM0_level2_quad_clean.evt |
| Size (bytes) | 790,038,720 | 244,944,000 |
| Size | 753.4 MB | 233.6 MB |
| Events in quadrant A | 5,013,666 | 1,533,944 |
| Events in quadrant B | 6,599,103 | 1,470,866 |
| Events in quadrant C | 4,084,037 | 1,544,566 |
| Events in quadrant D | 6,848,659 | 1,480,254 |
| Mode M0 | |||
|---|---|---|---|
| Quadrant | BADHDUFLAG | Total packets | Discarded packets |
| A | 0 | 47384 | 0 |
| B | 0 | 55268 | 0 |
| C | 0 | 42592 | 0 |
| D | 0 | 50122 | 0 |
| Mode SS | |||
|---|---|---|---|
| Quadrant | BADHDUFLAG | Total packets | Discarded packets |
| A | 0 | 410 | 0 |
| B | 0 | 410 | 0 |
| C | 0 | 410 | 0 |
| D | 0 | 410 | 0 |
| Mode M9 | |||
|---|---|---|---|
| Quadrant | BADHDUFLAG | Total packets | Discarded packets |
| A | 0 | 11 | 0 |
| B | 0 | 11 | 0 |
| C | 0 | 11 | 0 |
| D | 0 | 11 | 0 |
| Quadrant | Total seconds | Saturated seconds | Saturation percentage |
|---|---|---|---|
| A | 20152 | 899 | 4.461096% |
| B | 20152 | 2524 | 12.524811% |
| C | 20152 | 429 | 2.128821% |
| D | 20152 | 613 | 3.041882% |
Noise dominated data is calculated using 1-second bins in cleaned event files. If a bin has >2000 counts, and if more than 50% of those come from <1% of pixels, then it is considered to be noise-dominated and hence unusable.
| Quadrant | # 1 sec bins | Bins with >0 counts | Bins with >2000 counts | High rate bins dominated by noise | Noise dominated (total time) | Noise dominated (detector-on time) | Marked lightcurve |
|---|---|---|---|---|---|---|---|
| A | 21323 | 20153 | 2 | 2 | 0.01% | 0.01% |  |
| B | 21323 | 20093 | 87 | 87 | 0.41% | 0.43% |  |
| C | 21323 | 20153 | 7 | 7 | 0.03% | 0.03% |  |
| D | 21323 | 20152 | 75 | 75 | 0.35% | 0.37% |  |
Top three noisy pixels from each quadrant. If the there are fewer than three noisy pixels in the level2.evt file, extra rows are filled as -1
| Pixel properties | Quadrant properties | ||||||
|---|---|---|---|---|---|---|---|
| Quadrant | DetID | PixID | Counts | Sigma | Mean | Median | Sigma |
| A | 12 | 189 | 509550 | 2290.89 | 995 | 968 | 222.0 |
| A | 15 | 223 | 236119 | 1059.23 | 995 | 968 | 222.0 |
| A | 1 | 162 | 198823 | 891.23 | 995 | 968 | 222.0 |
| B | 4 | 239 | 1400737 | 7460.61 | 947 | 918 | 187.6 |
| B | 3 | 64 | 1216049 | 6476.28 | 947 | 918 | 187.6 |
| B | 0 | 85 | 110339 | 583.18 | 947 | 918 | 187.6 |
| C | 7 | 238 | 147201 | 662.2 | 992 | 974 | 220.8 |
| C | 14 | 234 | 20525 | 88.54 | 992 | 974 | 220.8 |
| C | 0 | 207 | 11762 | 48.85 | 992 | 974 | 220.8 |
| D | 8 | 195 | 2277734 | 9653.39 | 996 | 956 | 235.9 |
| D | 1 | 52 | 536951 | 2272.58 | 996 | 956 | 235.9 |
| D | 2 | 234 | 82784 | 346.95 | 996 | 956 | 235.9 |
Histogram calculated using DETX and DETY for each event in the final _common_clean file
| Quadrant A |  |
 |
Quadrant B |
|---|---|---|---|
| Quadrant D |  |
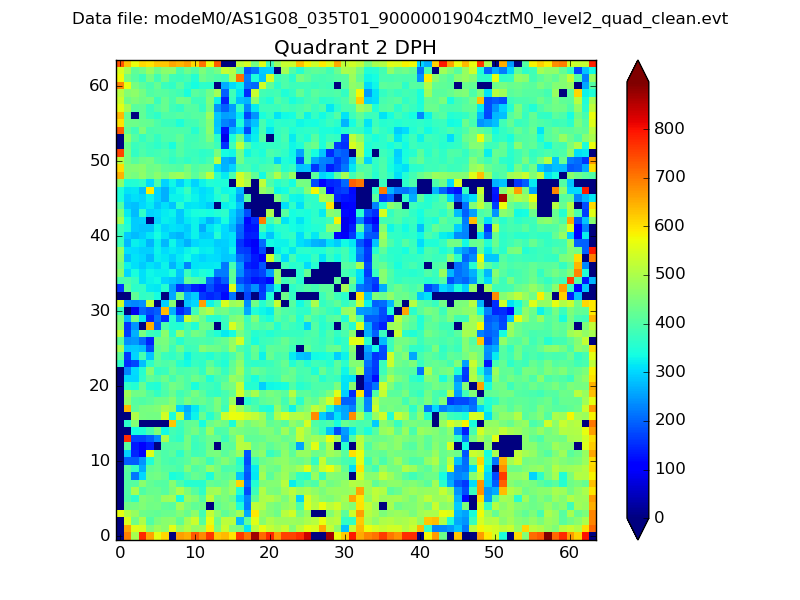 |
Quadrant C |
| Plot type | Count rate plots | Images |
|---|---|---|
| Comparison with Poisson distribution Blue bars denote a histogram of data divided into 1 sec bins. Red curve is a Poisson curve with rate = median count rate of data. |
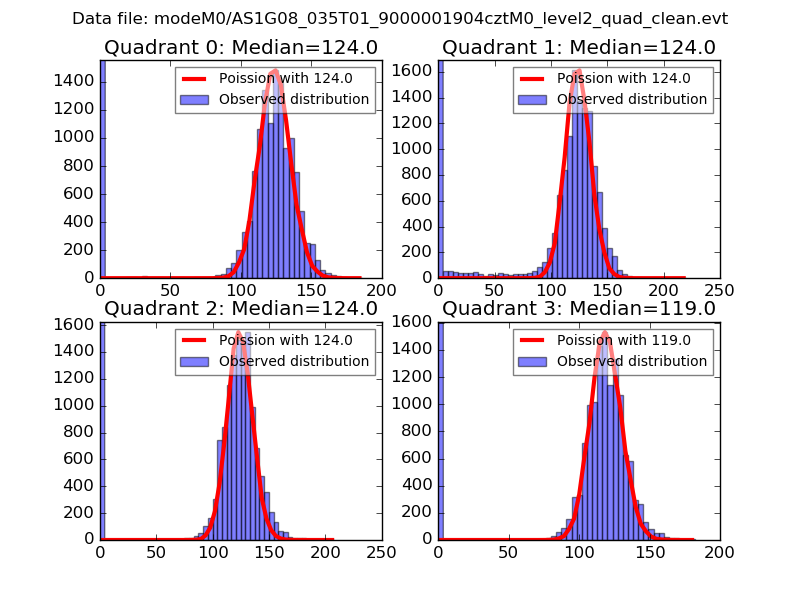 |
 |
| Quadrant-wise count rates Data is divided into 100 sec bins |
 |
|
| Module-wise count rates for Quadrant A Data is divided into 100 sec bins |
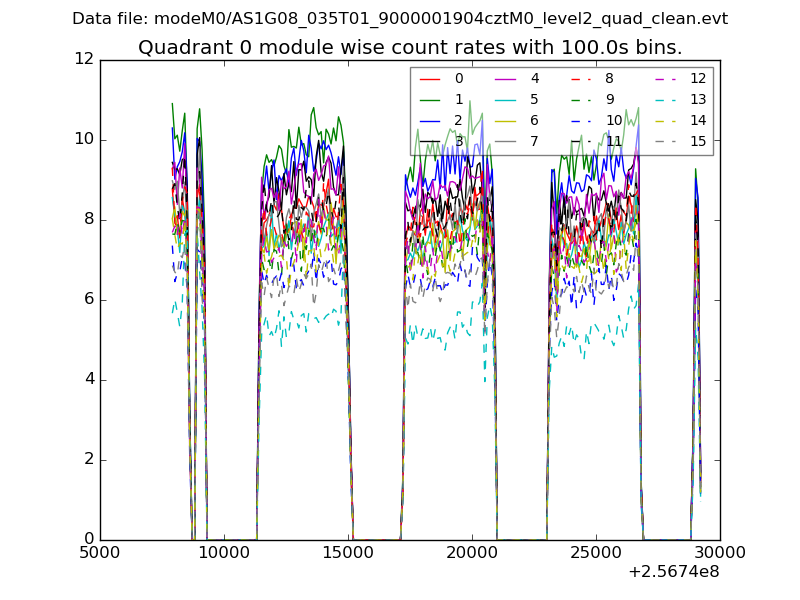 |
 |
| Module-wise count rates for Quadrant B Data is divided into 100 sec bins |
 |
 |
| Module-wise count rates for Quadrant C Data is divided into 100 sec bins |
 |
 |
| Module-wise count rates for Quadrant D Data is divided into 100 sec bins |
 |
 |
| Parameter | Plot |
|---|---|
| CZT HV Monitor |  |
| D_VDD | 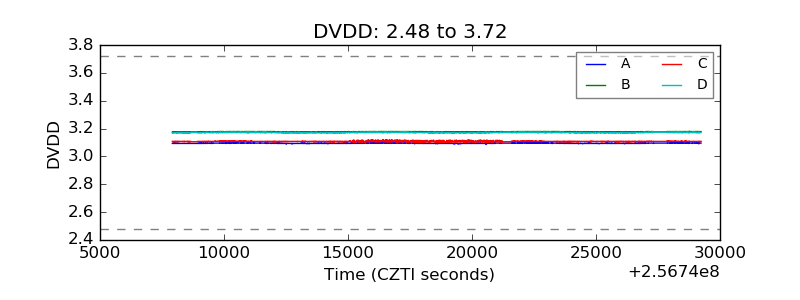 |
| Temperature 1 |  |
| Veto HV Monitor |  |
| Veto LLD |  |
| Alpha Counter |  |
| _CPM_Rate |  |
| CZT Counter |  |
| +2.5 Volts monitor |  |
| +5 Volts monitor | 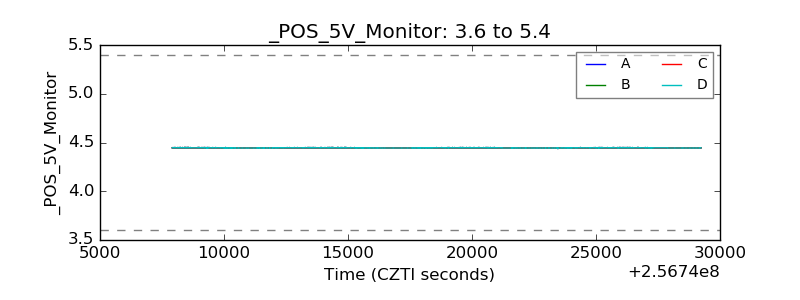 |
| _ROLL_ROT |  |
| _Roll_DEC |  |
| _Roll_RA |  |
| Veto Counter |  |