| Param | Original file | Final file |
|---|---|---|
| Filename | modeM0/AS1G08_033T01_9000001906cztM0_level2_bc.evt | modeM0/AS1G08_033T01_9000001906cztM0_level2_quad_clean.evt |
| Size (bytes) | 689,713,920 | 258,062,400 |
| Size | 657.8 MB | 246.1 MB |
| Events in quadrant A | 4,674,848 | 1,683,639 |
| Events in quadrant B | 5,942,950 | 1,627,142 |
| Events in quadrant C | 3,406,321 | 1,695,853 |
| Events in quadrant D | 5,651,565 | 1,589,846 |
| Mode M9 | |||
|---|---|---|---|
| Quadrant | BADHDUFLAG | Total packets | Discarded packets |
| A | 0 | 28 | 0 |
| B | 0 | 28 | 0 |
| C | 0 | 28 | 0 |
| D | 0 | 28 | 0 |
| Mode SS | |||
|---|---|---|---|
| Quadrant | BADHDUFLAG | Total packets | Discarded packets |
| A | 0 | 356 | 0 |
| B | 0 | 356 | 0 |
| C | 0 | 356 | 0 |
| D | 0 | 356 | 0 |
| Mode M0 | |||
|---|---|---|---|
| Quadrant | BADHDUFLAG | Total packets | Discarded packets |
| A | 0 | 41523 | 0 |
| B | 0 | 48369 | 0 |
| C | 0 | 35762 | 0 |
| D | 0 | 43138 | 0 |
| Quadrant | Total seconds | Saturated seconds | Saturation percentage |
|---|---|---|---|
| A | 17708 | 246 | 1.389203% |
| B | 17708 | 1662 | 9.385588% |
| C | 17708 | 42 | 0.237181% |
| D | 17708 | 522 | 2.947820% |
Noise dominated data is calculated using 1-second bins in cleaned event files. If a bin has >2000 counts, and if more than 50% of those come from <1% of pixels, then it is considered to be noise-dominated and hence unusable.
| Quadrant | # 1 sec bins | Bins with >0 counts | Bins with >2000 counts | High rate bins dominated by noise | Noise dominated (total time) | Noise dominated (detector-on time) | Marked lightcurve |
|---|---|---|---|---|---|---|---|
| A | 20365 | 17710 | 1 | 1 | 0.00% | 0.01% |  |
| B | 20365 | 17700 | 116 | 116 | 0.57% | 0.66% |  |
| C | 20365 | 17710 | 0 | 0 | 0.00% | 0.00% |  |
| D | 20365 | 17710 | 106 | 106 | 0.52% | 0.60% |  |
Top three noisy pixels from each quadrant. If the there are fewer than three noisy pixels in the level2.evt file, extra rows are filled as -1
| Pixel properties | Quadrant properties | ||||||
|---|---|---|---|---|---|---|---|
| Quadrant | DetID | PixID | Counts | Sigma | Mean | Median | Sigma |
| A | 12 | 189 | 539903 | 2752.46 | 871 | 852 | 195.8 |
| A | 15 | 223 | 360016 | 1833.93 | 871 | 852 | 195.8 |
| A | 1 | 162 | 199580 | 1014.73 | 871 | 852 | 195.8 |
| B | 4 | 239 | 1443450 | 8906.29 | 833 | 809 | 162.0 |
| B | 3 | 64 | 963632 | 5944.08 | 833 | 809 | 162.0 |
| B | 0 | 85 | 121633 | 745.92 | 833 | 809 | 162.0 |
| C | 14 | 234 | 21100 | 104.27 | 863 | 850 | 194.2 |
| C | 8 | 222 | 5450 | 23.69 | 863 | 850 | 194.2 |
| C | 13 | 61 | 5082 | 21.79 | 863 | 850 | 194.2 |
| D | 1 | 52 | 1228623 | 6059.8 | 858 | 826 | 202.6 |
| D | 8 | 195 | 615956 | 3035.98 | 858 | 826 | 202.6 |
| D | 13 | 122 | 175632 | 862.76 | 858 | 826 | 202.6 |
Histogram calculated using DETX and DETY for each event in the final _common_clean file
| Quadrant A | 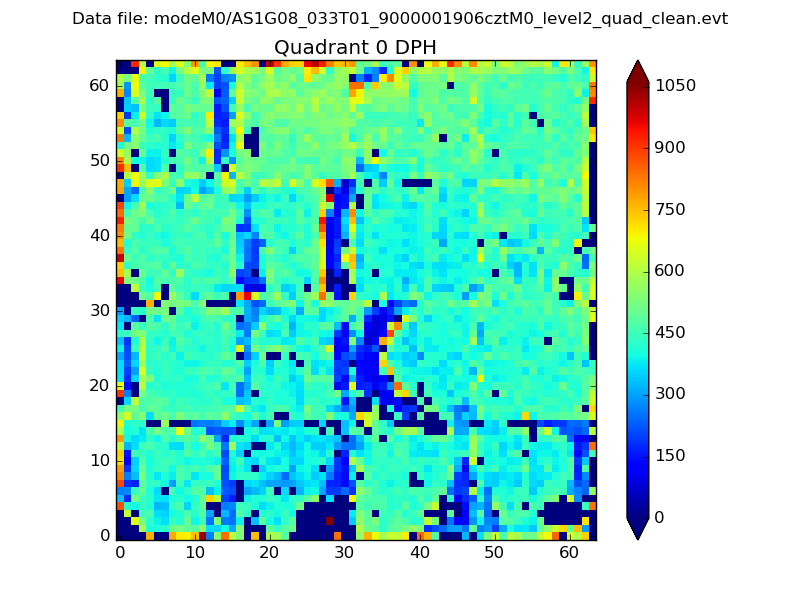 |
 |
Quadrant B |
|---|---|---|---|
| Quadrant D |  |
 |
Quadrant C |
| Plot type | Count rate plots | Images |
|---|---|---|
| Comparison with Poisson distribution Blue bars denote a histogram of data divided into 1 sec bins. Red curve is a Poisson curve with rate = median count rate of data. |
 |
 |
| Quadrant-wise count rates Data is divided into 100 sec bins |
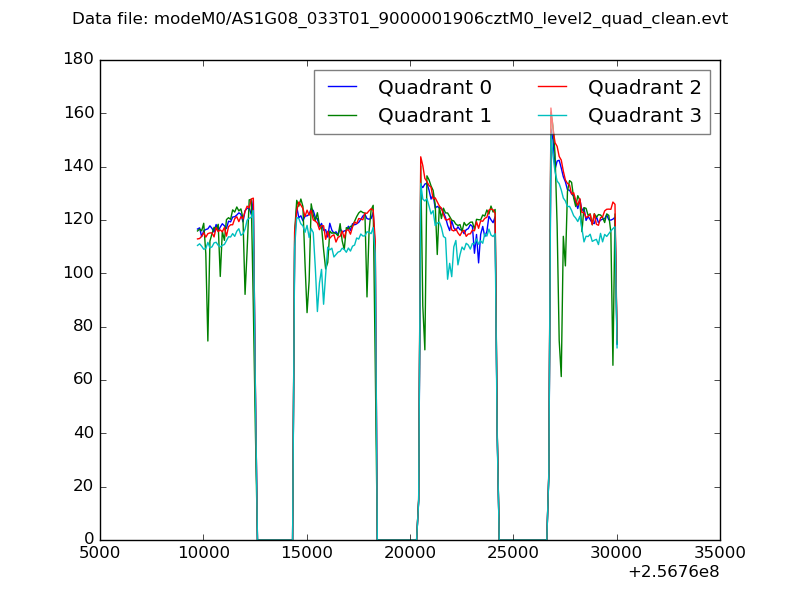 |
|
| Module-wise count rates for Quadrant A Data is divided into 100 sec bins |
 |
 |
| Module-wise count rates for Quadrant B Data is divided into 100 sec bins |
 |
 |
| Module-wise count rates for Quadrant C Data is divided into 100 sec bins |
 |
 |
| Module-wise count rates for Quadrant D Data is divided into 100 sec bins |
 |
 |
| Parameter | Plot |
|---|---|
| CZT HV Monitor |  |
| D_VDD |  |
| Temperature 1 |  |
| Veto HV Monitor |  |
| Veto LLD |  |
| Alpha Counter | 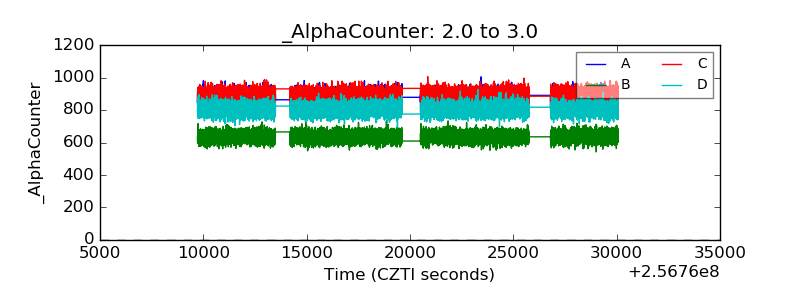 |
| _CPM_Rate |  |
| CZT Counter |  |
| +2.5 Volts monitor |  |
| +5 Volts monitor |  |
| _ROLL_ROT |  |
| _Roll_DEC | 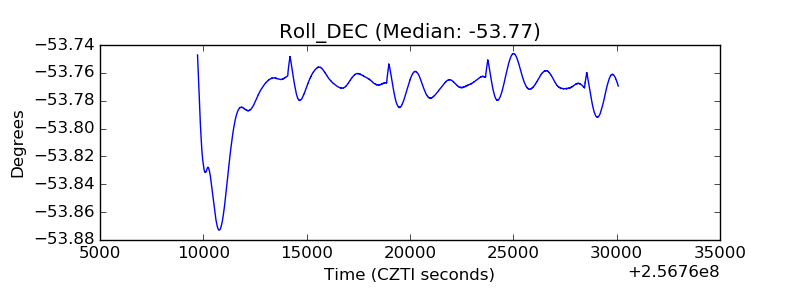 |
| _Roll_RA |  |
| Veto Counter | 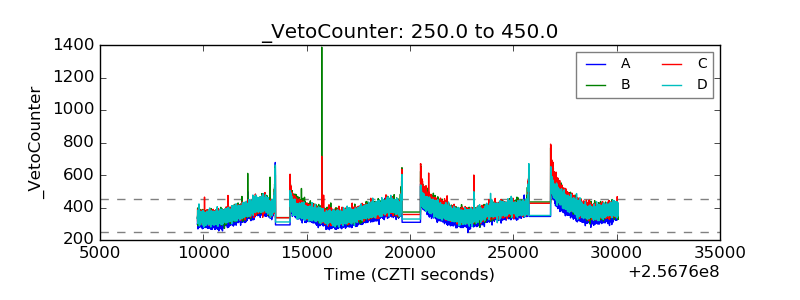 |