| Param | Original file | Final file |
|---|---|---|
| Filename | modeM0/AS1G08_043T01_9000001902cztM0_level2_bc.evt | modeM0/AS1G08_043T01_9000001902cztM0_level2_quad_clean.evt |
| Size (bytes) | 1,688,739,840 | 582,742,080 |
| Size | 1.6 GB | 555.7 MB |
| Events in quadrant A | 10,299,684 | 3,782,848 |
| Events in quadrant B | 16,117,538 | 3,413,203 |
| Events in quadrant C | 9,265,164 | 3,810,199 |
| Events in quadrant D | 12,445,860 | 3,610,756 |
| Mode M0 | |||
|---|---|---|---|
| Quadrant | BADHDUFLAG | Total packets | Discarded packets |
| A | 0 | 95147 | 0 |
| B | 0 | 128296 | 0 |
| C | 0 | 90990 | 0 |
| D | 0 | 99916 | 0 |
| Mode M9 | |||
|---|---|---|---|
| Quadrant | BADHDUFLAG | Total packets | Discarded packets |
| A | 0 | 89 | 0 |
| B | 0 | 89 | 0 |
| C | 0 | 89 | 0 |
| D | 0 | 89 | 0 |
| Mode SS | |||
|---|---|---|---|
| Quadrant | BADHDUFLAG | Total packets | Discarded packets |
| A | 0 | 900 | 0 |
| B | 0 | 900 | 0 |
| C | 0 | 900 | 0 |
| D | 0 | 900 | 0 |
| Quadrant | Total seconds | Saturated seconds | Saturation percentage |
|---|---|---|---|
| A | 44170 | 514 | 1.163686% |
| B | 44170 | 6043 | 13.681232% |
| C | 44170 | 401 | 0.907856% |
| D | 44170 | 594 | 1.344804% |
Noise dominated data is calculated using 1-second bins in cleaned event files. If a bin has >2000 counts, and if more than 50% of those come from <1% of pixels, then it is considered to be noise-dominated and hence unusable.
| Quadrant | # 1 sec bins | Bins with >0 counts | Bins with >2000 counts | High rate bins dominated by noise | Noise dominated (total time) | Noise dominated (detector-on time) | Marked lightcurve |
|---|---|---|---|---|---|---|---|
| A | 53131 | 44172 | 2 | 2 | 0.00% | 0.00% | 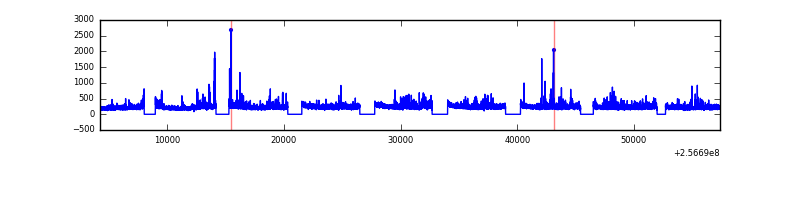 |
| B | 53131 | 44019 | 297 | 297 | 0.56% | 0.67% | 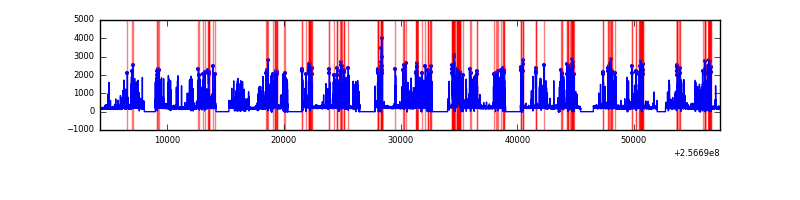 |
| C | 53131 | 44173 | 0 | 0 | 0.00% | 0.00% | 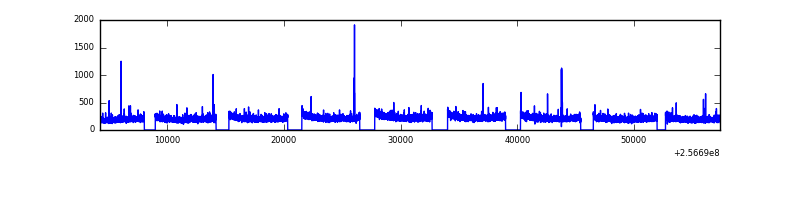 |
| D | 53131 | 44172 | 50 | 50 | 0.09% | 0.11% |  |
Top three noisy pixels from each quadrant. If the there are fewer than three noisy pixels in the level2.evt file, extra rows are filled as -1
| Pixel properties | Quadrant properties | ||||||
|---|---|---|---|---|---|---|---|
| Quadrant | DetID | PixID | Counts | Sigma | Mean | Median | Sigma |
| A | 12 | 189 | 578840 | 1142.45 | 2357 | 2313 | 504.6 |
| A | 1 | 162 | 283012 | 556.24 | 2357 | 2313 | 504.6 |
| A | 15 | 239 | 236367 | 463.8 | 2357 | 2313 | 504.6 |
| B | 4 | 239 | 4829280 | 11889.99 | 2171 | 2124 | 406.0 |
| B | 3 | 64 | 1706151 | 4197.27 | 2171 | 2124 | 406.0 |
| B | 0 | 85 | 735450 | 1806.29 | 2171 | 2124 | 406.0 |
| C | 3 | 248 | 40603 | 74.42 | 2350 | 2330 | 514.3 |
| C | 8 | 222 | 23980 | 42.1 | 2350 | 2330 | 514.3 |
| C | 14 | 234 | 14814 | 24.27 | 2350 | 2330 | 514.3 |
| D | 1 | 52 | 2171594 | 4008.33 | 2350 | 2274 | 541.2 |
| D | 8 | 195 | 953751 | 1758.08 | 2350 | 2274 | 541.2 |
| D | 2 | 234 | 169067 | 308.19 | 2350 | 2274 | 541.2 |
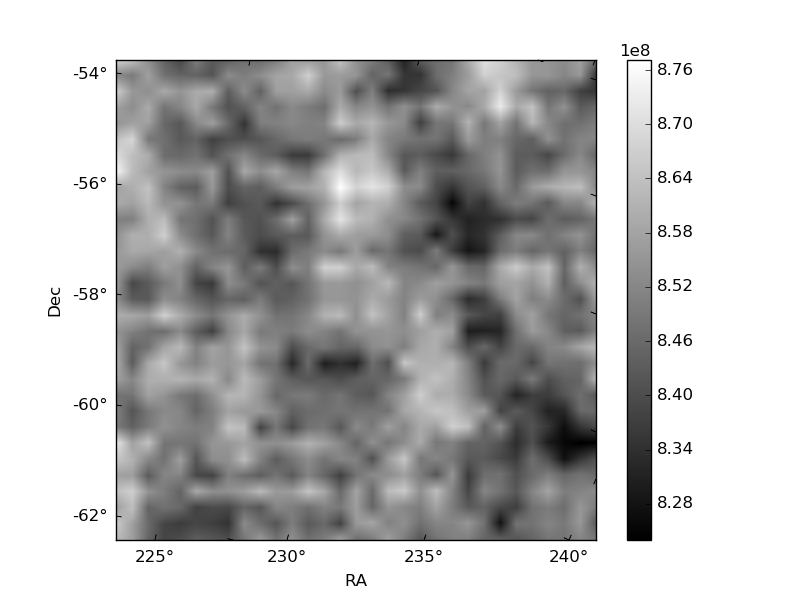
Histogram calculated using DETX and DETY for each event in the final _common_clean file
| Quadrant A | 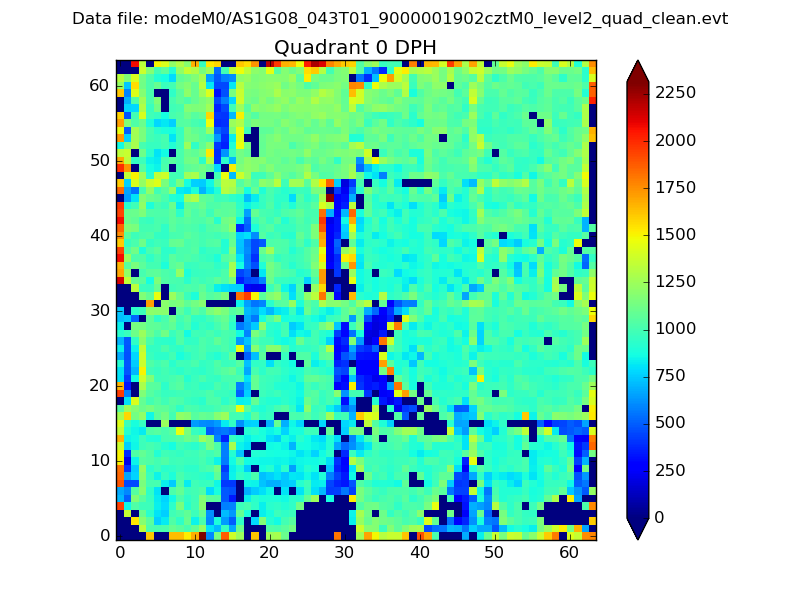 |
 |
Quadrant B |
|---|---|---|---|
| Quadrant D |  |
 |
Quadrant C |
| Plot type | Count rate plots | Images |
|---|---|---|
| Comparison with Poisson distribution Blue bars denote a histogram of data divided into 1 sec bins. Red curve is a Poisson curve with rate = median count rate of data. |
 |
 |
| Quadrant-wise count rates Data is divided into 100 sec bins |
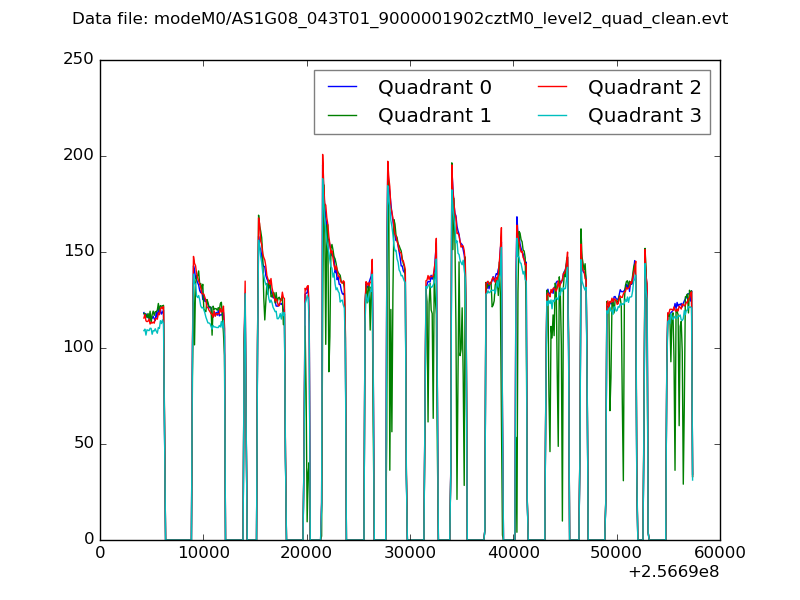 |
|
| Module-wise count rates for Quadrant A Data is divided into 100 sec bins |
 |
 |
| Module-wise count rates for Quadrant B Data is divided into 100 sec bins |
 |
 |
| Module-wise count rates for Quadrant C Data is divided into 100 sec bins |
 |
 |
| Module-wise count rates for Quadrant D Data is divided into 100 sec bins |
 |
 |
| Parameter | Plot |
|---|---|
| CZT HV Monitor |  |
| D_VDD |  |
| Temperature 1 | 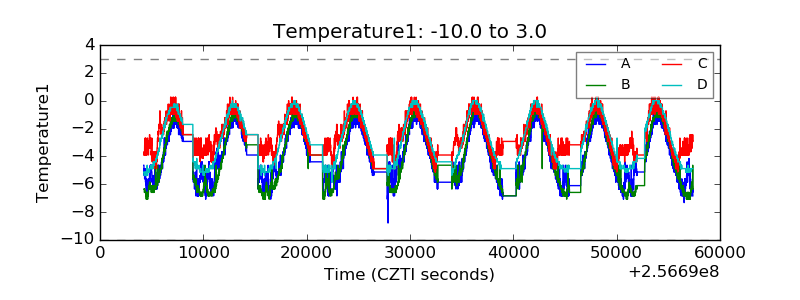 |
| Veto HV Monitor |  |
| Veto LLD | 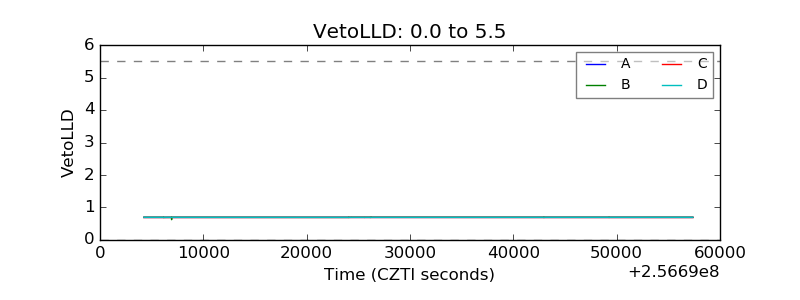 |
| Alpha Counter |  |
| _CPM_Rate | 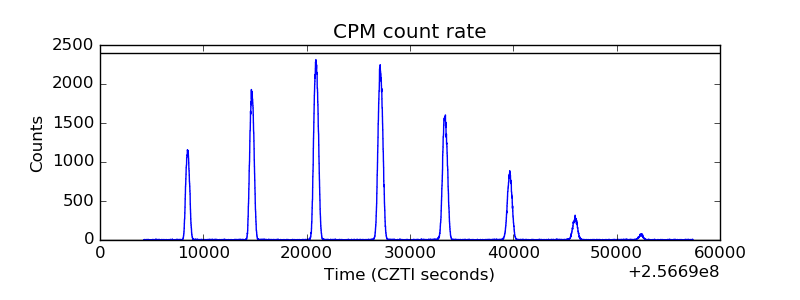 |
| CZT Counter |  |
| +2.5 Volts monitor |  |
| +5 Volts monitor |  |
| _ROLL_ROT | 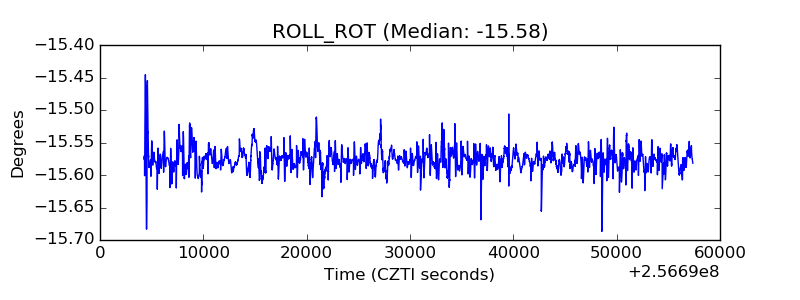 |
| _Roll_DEC |  |
| _Roll_RA |  |
| Veto Counter |  |