| Param | Original file | Final file |
|---|---|---|
| Filename | modeM0/AS1A04_224T03_9000001898cztM0_level2_bc.evt | modeM0/AS1A04_224T03_9000001898cztM0_level2_quad_clean.evt |
| Size (bytes) | 505,903,680 | 253,693,440 |
| Size | 482.5 MB | 241.9 MB |
| Events in quadrant A | 3,771,783 | 1,729,384 |
| Events in quadrant B | 4,669,547 | 1,595,878 |
| Events in quadrant C | 2,696,855 | 1,738,987 |
| Events in quadrant D | 3,244,476 | 1,676,441 |
| Mode M9 | |||
|---|---|---|---|
| Quadrant | BADHDUFLAG | Total packets | Discarded packets |
| A | 0 | 22 | 0 |
| B | 0 | 22 | 0 |
| C | 0 | 22 | 0 |
| D | 0 | 22 | 0 |
| Mode M0 | |||
|---|---|---|---|
| Quadrant | BADHDUFLAG | Total packets | Discarded packets |
| A | 0 | 33529 | 0 |
| B | 0 | 39847 | 0 |
| C | 0 | 28051 | 0 |
| D | 0 | 29285 | 0 |
| Mode SS | |||
|---|---|---|---|
| Quadrant | BADHDUFLAG | Total packets | Discarded packets |
| A | 0 | 278 | 0 |
| B | 0 | 278 | 0 |
| C | 0 | 278 | 0 |
| D | 0 | 278 | 0 |
| Quadrant | Total seconds | Saturated seconds | Saturation percentage |
|---|---|---|---|
| A | 13657 | 646 | 4.730175% |
| B | 13657 | 2169 | 15.881965% |
| C | 13657 | 283 | 2.072197% |
| D | 13657 | 324 | 2.372410% |
Noise dominated data is calculated using 1-second bins in cleaned event files. If a bin has >2000 counts, and if more than 50% of those come from <1% of pixels, then it is considered to be noise-dominated and hence unusable.
| Quadrant | # 1 sec bins | Bins with >0 counts | Bins with >2000 counts | High rate bins dominated by noise | Noise dominated (total time) | Noise dominated (detector-on time) | Marked lightcurve |
|---|---|---|---|---|---|---|---|
| A | 15708 | 13661 | 3 | 3 | 0.02% | 0.02% |  |
| B | 15707 | 13586 | 89 | 89 | 0.57% | 0.66% |  |
| C | 15708 | 13660 | 0 | 0 | 0.00% | 0.00% |  |
| D | 15708 | 13660 | 14 | 14 | 0.09% | 0.10% |  |
Top three noisy pixels from each quadrant. If the there are fewer than three noisy pixels in the level2.evt file, extra rows are filled as -1
| Pixel properties | Quadrant properties | ||||||
|---|---|---|---|---|---|---|---|
| Quadrant | DetID | PixID | Counts | Sigma | Mean | Median | Sigma |
| A | 15 | 223 | 405834 | 2631.27 | 694 | 681 | 154.0 |
| A | 15 | 239 | 352536 | 2285.12 | 694 | 681 | 154.0 |
| A | 1 | 162 | 142967 | 924.08 | 694 | 681 | 154.0 |
| B | 4 | 239 | 1826344 | 14901.92 | 638 | 623 | 122.5 |
| B | 3 | 64 | 263206 | 2143.26 | 638 | 623 | 122.5 |
| B | 0 | 214 | 30903 | 247.15 | 638 | 623 | 122.5 |
| C | 8 | 222 | 4340 | 23.81 | 686 | 677 | 153.8 |
| C | 13 | 61 | 4111 | 22.32 | 686 | 677 | 153.8 |
| C | 12 | 4 | 3990 | 21.53 | 686 | 677 | 153.8 |
| D | 1 | 52 | 294182 | 1829.34 | 692 | 667 | 160.4 |
| D | 8 | 195 | 123614 | 766.27 | 692 | 667 | 160.4 |
| D | 2 | 14 | 57053 | 351.42 | 692 | 667 | 160.4 |
Histogram calculated using DETX and DETY for each event in the final _common_clean file
| Quadrant A |  |
 |
Quadrant B |
|---|---|---|---|
| Quadrant D |  |
 |
Quadrant C |
| Plot type | Count rate plots | Images |
|---|---|---|
| Comparison with Poisson distribution Blue bars denote a histogram of data divided into 1 sec bins. Red curve is a Poisson curve with rate = median count rate of data. |
 |
 |
| Quadrant-wise count rates Data is divided into 100 sec bins |
 |
|
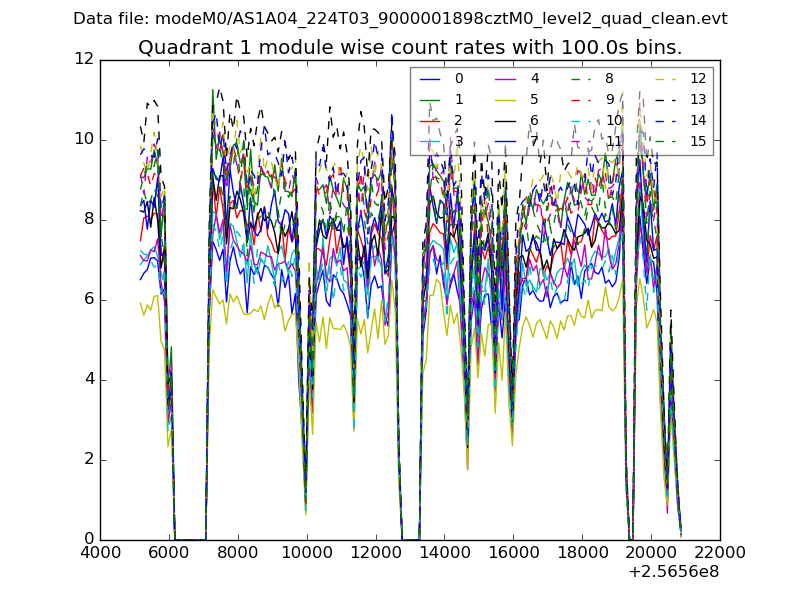
| Module-wise count rates for Quadrant A Data is divided into 100 sec bins |
 |
 |
| Module-wise count rates for Quadrant B Data is divided into 100 sec bins |
 |
 |
| Module-wise count rates for Quadrant C Data is divided into 100 sec bins |
 |
 |
| Module-wise count rates for Quadrant D Data is divided into 100 sec bins |
 |
 |
| Parameter | Plot |
|---|---|
| CZT HV Monitor |  |
| D_VDD |  |
| Temperature 1 |  |
| Veto HV Monitor |  |
| Veto LLD |  |
| Alpha Counter | 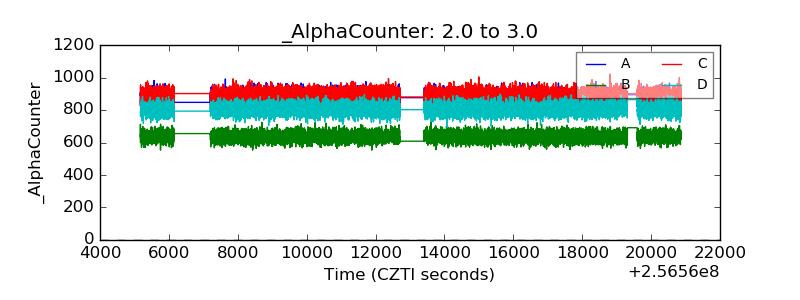 |
| _CPM_Rate |  |
| CZT Counter |  |
| +2.5 Volts monitor |  |
| +5 Volts monitor |  |
| _ROLL_ROT |  |
| _Roll_DEC | 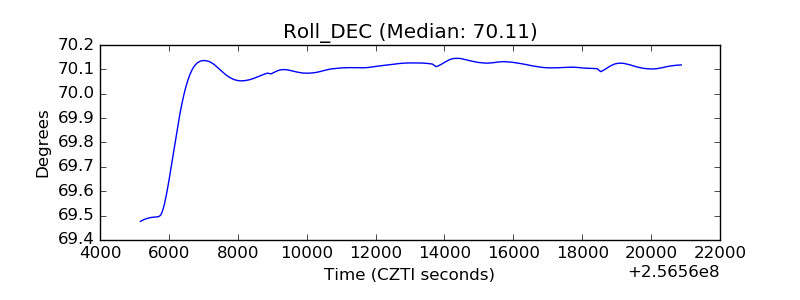 |
| _Roll_RA |  |
| Veto Counter |  |