| Param | Original file | Final file |
|---|---|---|
| Filename | modeM0/AS1A04_115T02_9000001900cztM0_level2_bc.evt | modeM0/AS1A04_115T02_9000001900cztM0_level2_quad_clean.evt |
| Size (bytes) | 4,199,094,720 | 1,153,221,120 |
| Size | 3.9 GB | 1.1 GB |
| Events in quadrant A | 23,627,171 | 7,263,832 |
| Events in quadrant B | 34,097,255 | 6,833,836 |
| Events in quadrant C | 19,571,065 | 7,370,966 |
| Events in quadrant D | 43,194,956 | 6,736,749 |
| Mode SS | |||
|---|---|---|---|
| Quadrant | BADHDUFLAG | Total packets | Discarded packets |
| A | 0 | 1998 | 0 |
| B | 0 | 1998 | 0 |
| C | 0 | 1998 | 0 |
| D | 0 | 1998 | 0 |
| Mode M0 | |||
|---|---|---|---|
| Quadrant | BADHDUFLAG | Total packets | Discarded packets |
| A | 0 | 222391 | 0 |
| B | 0 | 273940 | 0 |
| C | 0 | 201211 | 0 |
| D | 0 | 287424 | 0 |
| Mode M9 | |||
|---|---|---|---|
| Quadrant | BADHDUFLAG | Total packets | Discarded packets |
| A | 0 | 136 | 0 |
| B | 0 | 136 | 0 |
| C | 0 | 136 | 0 |
| D | 0 | 136 | 0 |
| Quadrant | Total seconds | Saturated seconds | Saturation percentage |
|---|---|---|---|
| A | 98037 | 1919 | 1.957424% |
| B | 98037 | 10937 | 11.155992% |
| C | 98037 | 671 | 0.684435% |
| D | 98037 | 9201 | 9.385232% |
Noise dominated data is calculated using 1-second bins in cleaned event files. If a bin has >2000 counts, and if more than 50% of those come from <1% of pixels, then it is considered to be noise-dominated and hence unusable.
| Quadrant | # 1 sec bins | Bins with >0 counts | Bins with >2000 counts | High rate bins dominated by noise | Noise dominated (total time) | Noise dominated (detector-on time) | Marked lightcurve |
|---|---|---|---|---|---|---|---|
| A | 111568 | 98041 | 165 | 165 | 0.15% | 0.17% |  |
| B | 111568 | 97863 | 881 | 881 | 0.79% | 0.90% | 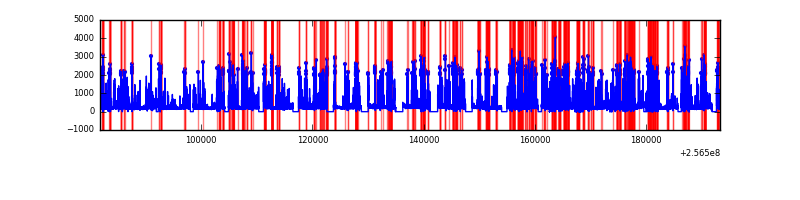 |
| C | 111568 | 98040 | 1 | 1 | 0.00% | 0.00% | 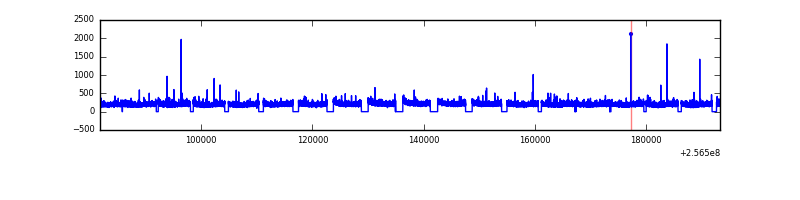 |
| D | 111568 | 98037 | 2978 | 2978 | 2.67% | 3.04% |  |
Top three noisy pixels from each quadrant. If the there are fewer than three noisy pixels in the level2.evt file, extra rows are filled as -1
| Pixel properties | Quadrant properties | ||||||
|---|---|---|---|---|---|---|---|
| Quadrant | DetID | PixID | Counts | Sigma | Mean | Median | Sigma |
| A | 15 | 239 | 1436157 | 1319.85 | 5035 | 4940 | 1084.4 |
| A | 1 | 162 | 1018331 | 934.54 | 5035 | 4940 | 1084.4 |
| A | 15 | 223 | 943207 | 865.26 | 5035 | 4940 | 1084.4 |
| B | 4 | 239 | 10314073 | 11315.9 | 4760 | 4631 | 911.1 |
| B | 3 | 64 | 4365585 | 4786.69 | 4760 | 4631 | 911.1 |
| B | 0 | 214 | 261103 | 281.51 | 4760 | 4631 | 911.1 |
| C | 4 | 112 | 43375 | 35.59 | 4969 | 4904 | 1080.9 |
| C | 14 | 234 | 33520 | 26.47 | 4969 | 4904 | 1080.9 |
| C | 13 | 61 | 29581 | 22.83 | 4969 | 4904 | 1080.9 |
| D | 1 | 52 | 15280492 | 13886.81 | 4813 | 4642 | 1100.0 |
| D | 12 | 110 | 5689384 | 5167.82 | 4813 | 4642 | 1100.0 |
| D | 10 | 157 | 1540892 | 1396.56 | 4813 | 4642 | 1100.0 |
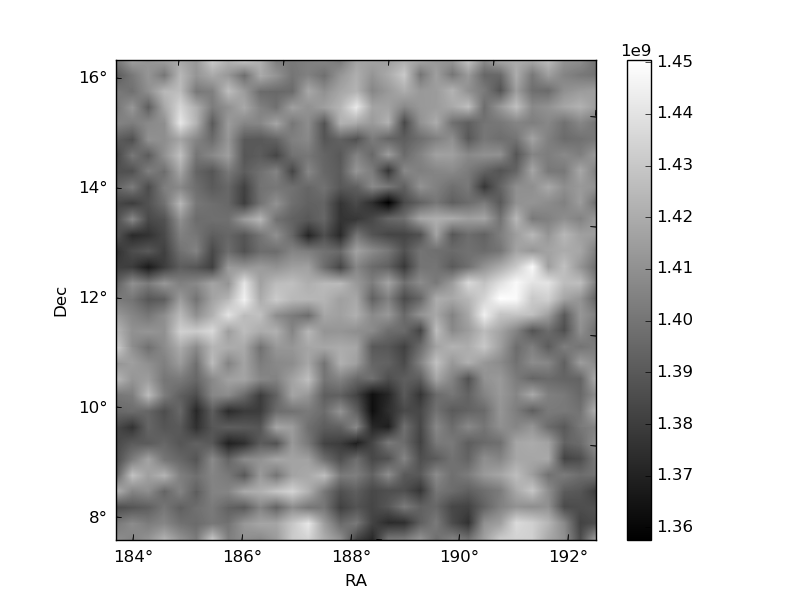
Histogram calculated using DETX and DETY for each event in the final _common_clean file
| Quadrant A |  |
 |
Quadrant B |
|---|---|---|---|
| Quadrant D |  |
 |
Quadrant C |
| Plot type | Count rate plots | Images |
|---|---|---|
| Comparison with Poisson distribution Blue bars denote a histogram of data divided into 1 sec bins. Red curve is a Poisson curve with rate = median count rate of data. |
 |
 |
| Quadrant-wise count rates Data is divided into 100 sec bins |
 |
|
| Module-wise count rates for Quadrant A Data is divided into 100 sec bins |
 |
 |
| Module-wise count rates for Quadrant B Data is divided into 100 sec bins |
 |
 |
| Module-wise count rates for Quadrant C Data is divided into 100 sec bins |
 |
 |
| Module-wise count rates for Quadrant D Data is divided into 100 sec bins |
 |
 |
| Parameter | Plot |
|---|---|
| CZT HV Monitor | 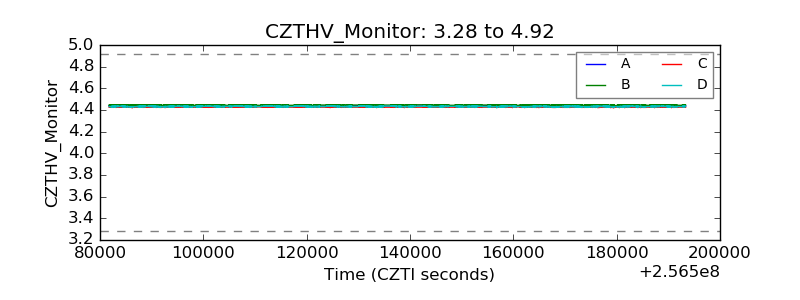 |
| D_VDD | 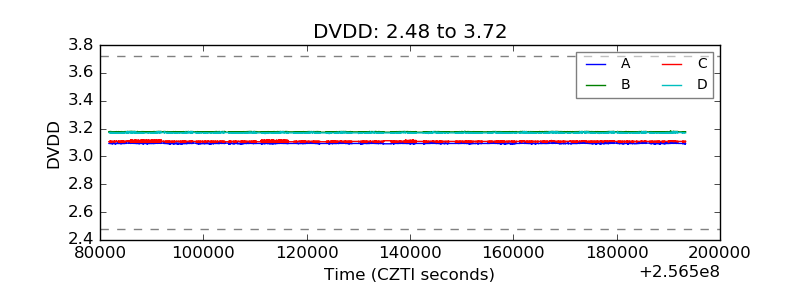 |
| Temperature 1 |  |
| Veto HV Monitor |  |
| Veto LLD |  |
| Alpha Counter | 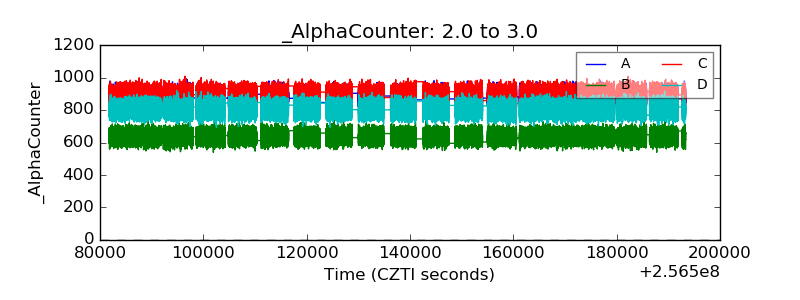 |
| _CPM_Rate |  |
| CZT Counter |  |
| +2.5 Volts monitor |  |
| +5 Volts monitor |  |
| _ROLL_ROT |  |
| _Roll_DEC | 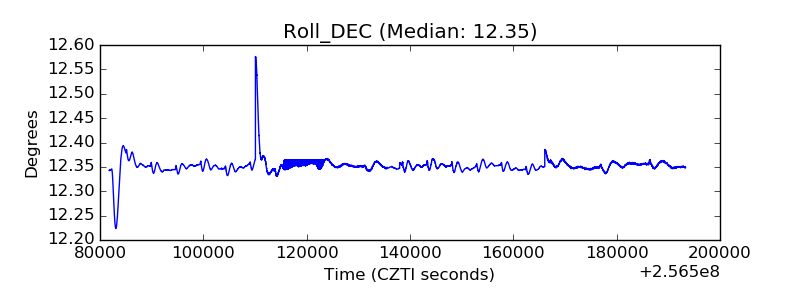 |
| _Roll_RA |  |
| Veto Counter |  |