| Param | Original file | Final file |
|---|---|---|
| Filename | modeM0/AS1A04_116T01_9000001896cztM0_level2_bc.evt | modeM0/AS1A04_116T01_9000001896cztM0_level2_quad_clean.evt |
| Size (bytes) | 6,831,858,240 | 2,773,560,960 |
| Size | 6.4 GB | 2.6 GB |
| Events in quadrant A | 40,399,999 | 18,838,422 |
| Events in quadrant B | 60,118,368 | 17,089,505 |
| Events in quadrant C | 34,320,781 | 18,875,378 |
| Events in quadrant D | 60,677,852 | 17,751,495 |
| Mode SS | |||
|---|---|---|---|
| Quadrant | BADHDUFLAG | Total packets | Discarded packets |
| A | 0 | 3406 | 0 |
| B | 0 | 3406 | 0 |
| C | 0 | 3406 | 0 |
| D | 0 | 3406 | 0 |
| Mode M9 | |||
|---|---|---|---|
| Quadrant | BADHDUFLAG | Total packets | Discarded packets |
| A | 0 | 277 | 0 |
| B | 0 | 277 | 0 |
| C | 0 | 277 | 0 |
| D | 0 | 277 | 0 |
| Mode M0 | |||
|---|---|---|---|
| Quadrant | BADHDUFLAG | Total packets | Discarded packets |
| A | 0 | 369454 | 0 |
| B | 0 | 493214 | 0 |
| C | 0 | 344696 | 0 |
| D | 0 | 428587 | 0 |
| Quadrant | Total seconds | Saturated seconds | Saturation percentage |
|---|---|---|---|
| A | 167147 | 2805 | 1.678164% |
| B | 167147 | 25267 | 15.116634% |
| C | 167147 | 1357 | 0.811860% |
| D | 167147 | 6811 | 4.074856% |
Noise dominated data is calculated using 1-second bins in cleaned event files. If a bin has >2000 counts, and if more than 50% of those come from <1% of pixels, then it is considered to be noise-dominated and hence unusable.
| Quadrant | # 1 sec bins | Bins with >0 counts | Bins with >2000 counts | High rate bins dominated by noise | Noise dominated (total time) | Noise dominated (detector-on time) | Marked lightcurve |
|---|---|---|---|---|---|---|---|
| A | 195044 | 167154 | 45 | 45 | 0.02% | 0.03% |  |
| B | 195044 | 166467 | 694 | 694 | 0.36% | 0.42% |  |
| C | 195044 | 167152 | 0 | 0 | 0.00% | 0.00% |  |
| D | 195044 | 167152 | 1588 | 1588 | 0.81% | 0.95% | 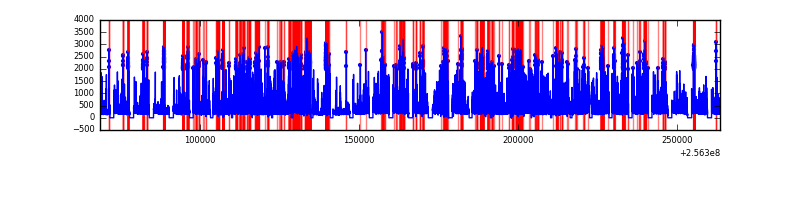 |
Top three noisy pixels from each quadrant. If the there are fewer than three noisy pixels in the level2.evt file, extra rows are filled as -1
| Pixel properties | Quadrant properties | ||||||
|---|---|---|---|---|---|---|---|
| Quadrant | DetID | PixID | Counts | Sigma | Mean | Median | Sigma |
| A | 12 | 189 | 1477261 | 762.0 | 8857 | 8716 | 1927.2 |
| A | 1 | 162 | 947049 | 486.88 | 8857 | 8716 | 1927.2 |
| A | 15 | 174 | 929390 | 477.72 | 8857 | 8716 | 1927.2 |
| B | 4 | 239 | 18969030 | 12623.89 | 8087 | 7901 | 1502.0 |
| B | 0 | 85 | 4450710 | 2957.92 | 8087 | 7901 | 1502.0 |
| B | 3 | 64 | 2574744 | 1708.95 | 8087 | 7901 | 1502.0 |
| C | 4 | 112 | 234118 | 118.71 | 8669 | 8592 | 1899.7 |
| C | 14 | 234 | 55678 | 24.79 | 8669 | 8592 | 1899.7 |
| C | 13 | 61 | 52710 | 23.22 | 8669 | 8592 | 1899.7 |
| D | 1 | 52 | 19011542 | 9570.87 | 8603 | 8335 | 1985.5 |
| D | 8 | 195 | 2525426 | 1267.72 | 8603 | 8335 | 1985.5 |
| D | 13 | 122 | 1428348 | 715.18 | 8603 | 8335 | 1985.5 |
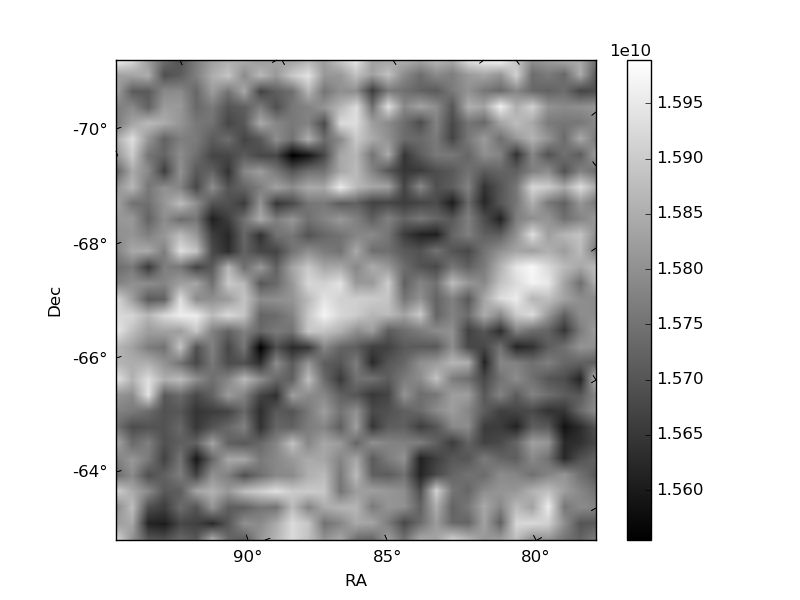
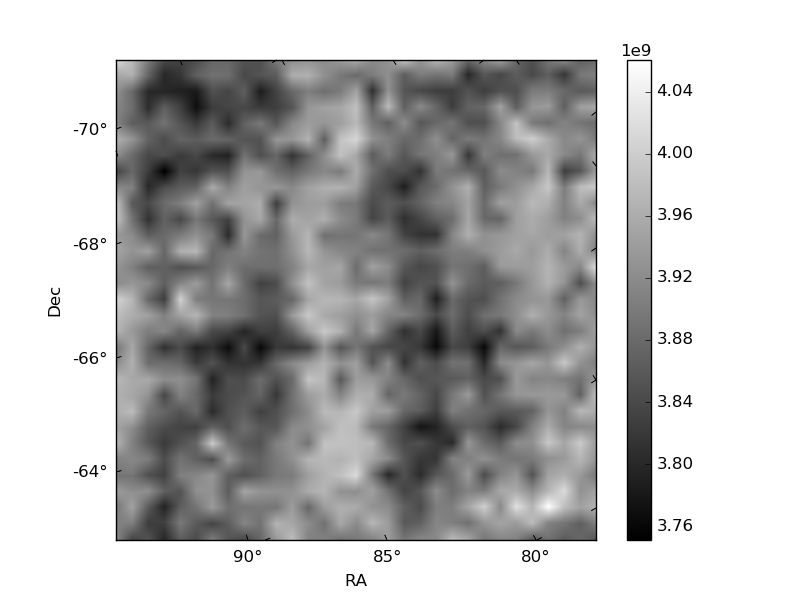
Histogram calculated using DETX and DETY for each event in the final _common_clean file
| Quadrant A |  |
 |
Quadrant B |
|---|---|---|---|
| Quadrant D |  |
 |
Quadrant C |
| Plot type | Count rate plots | Images |
|---|---|---|
| Comparison with Poisson distribution Blue bars denote a histogram of data divided into 1 sec bins. Red curve is a Poisson curve with rate = median count rate of data. |
 |
 |
| Quadrant-wise count rates Data is divided into 100 sec bins |
 |
|
| Module-wise count rates for Quadrant A Data is divided into 100 sec bins |
 |
 |
| Module-wise count rates for Quadrant B Data is divided into 100 sec bins |
 |
 |
| Module-wise count rates for Quadrant C Data is divided into 100 sec bins |
 |
 |
| Module-wise count rates for Quadrant D Data is divided into 100 sec bins |
 |
 |
| Parameter | Plot |
|---|---|
| CZT HV Monitor |  |
| D_VDD | 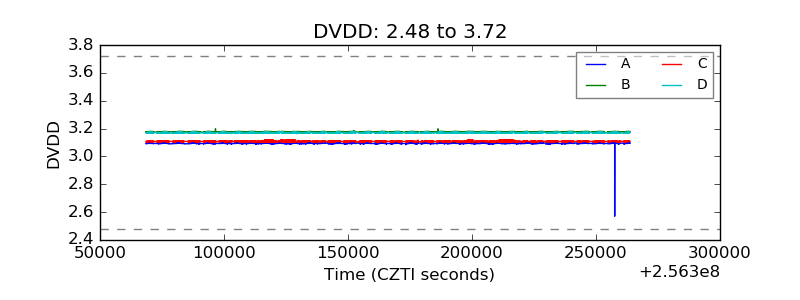 |
| Temperature 1 |  |
| Veto HV Monitor |  |
| Veto LLD |  |
| Alpha Counter | 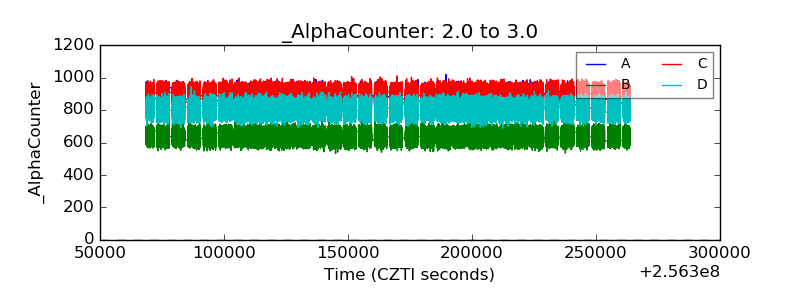 |
| _CPM_Rate |  |
| CZT Counter | 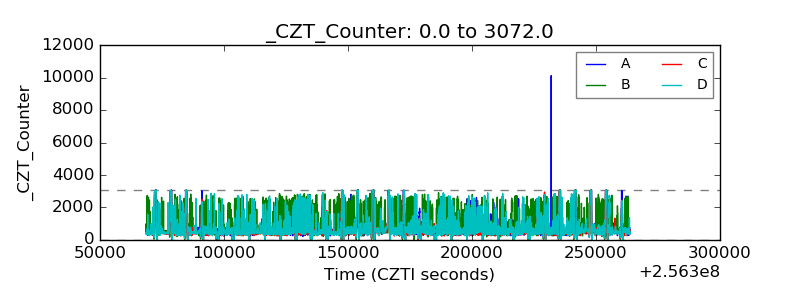 |
| +2.5 Volts monitor |  |
| +5 Volts monitor | 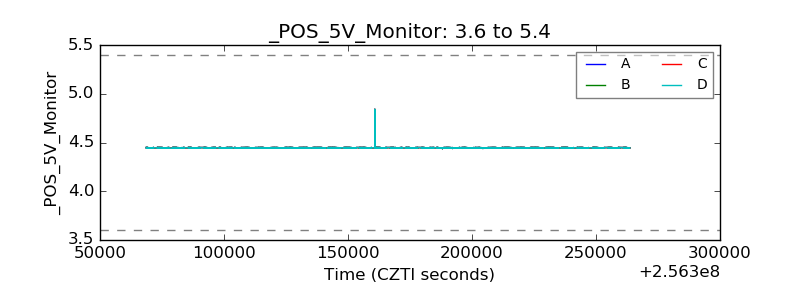 |
| _ROLL_ROT |  |
| _Roll_DEC |  |
| _Roll_RA |  |
| Veto Counter | 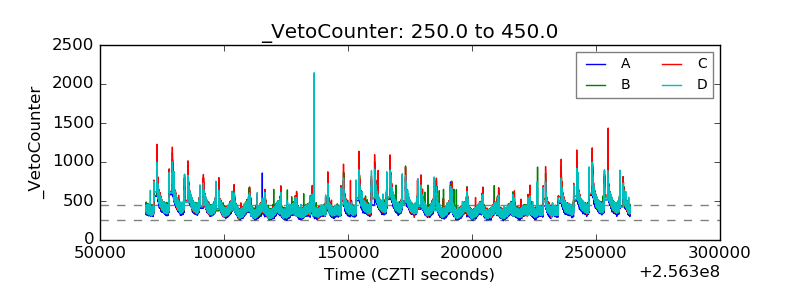 |