| Param | Original file | Final file |
|---|---|---|
| Filename | modeM0/AS1C03_001T01_9000001894cztM0_level2_bc.evt | modeM0/AS1C03_001T01_9000001894cztM0_level2_quad_clean.evt |
| Size (bytes) | 2,960,907,840 | 1,327,841,280 |
| Size | 2.8 GB | 1.2 GB |
| Events in quadrant A | 15,818,236 | 9,201,620 |
| Events in quadrant B | 27,245,080 | 8,590,306 |
| Events in quadrant C | 14,215,042 | 9,139,687 |
| Events in quadrant D | 27,450,275 | 8,316,967 |
| Mode M9 | |||
|---|---|---|---|
| Quadrant | BADHDUFLAG | Total packets | Discarded packets |
| A | 0 | 120 | 0 |
| B | 0 | 120 | 0 |
| C | 0 | 120 | 0 |
| D | 0 | 120 | 0 |
| Mode SS | |||
|---|---|---|---|
| Quadrant | BADHDUFLAG | Total packets | Discarded packets |
| A | 0 | 1480 | 0 |
| B | 0 | 1480 | 0 |
| C | 0 | 1480 | 0 |
| D | 0 | 1480 | 0 |
| Mode M0 | |||
|---|---|---|---|
| Quadrant | BADHDUFLAG | Total packets | Discarded packets |
| A | 0 | 154434 | 0 |
| B | 0 | 212007 | 0 |
| C | 0 | 147395 | 0 |
| D | 0 | 203974 | 0 |
| Quadrant | Total seconds | Saturated seconds | Saturation percentage |
|---|---|---|---|
| A | 72466 | 799 | 1.102586% |
| B | 72466 | 9188 | 12.679049% |
| C | 72466 | 419 | 0.578202% |
| D | 72466 | 6127 | 8.455000% |
Noise dominated data is calculated using 1-second bins in cleaned event files. If a bin has >2000 counts, and if more than 50% of those come from <1% of pixels, then it is considered to be noise-dominated and hence unusable.
| Quadrant | # 1 sec bins | Bins with >0 counts | Bins with >2000 counts | High rate bins dominated by noise | Noise dominated (total time) | Noise dominated (detector-on time) | Marked lightcurve |
|---|---|---|---|---|---|---|---|
| A | 84627 | 72467 | 6 | 6 | 0.01% | 0.01% |  |
| B | 84627 | 72304 | 288 | 288 | 0.34% | 0.40% |  |
| C | 84627 | 72465 | 0 | 0 | 0.00% | 0.00% |  |
| D | 84627 | 72456 | 796 | 796 | 0.94% | 1.10% | 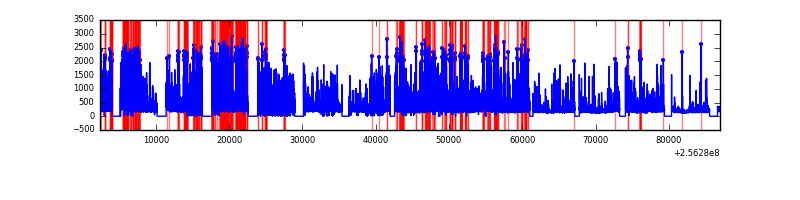 |
Top three noisy pixels from each quadrant. If the there are fewer than three noisy pixels in the level2.evt file, extra rows are filled as -1
| Pixel properties | Quadrant properties | ||||||
|---|---|---|---|---|---|---|---|
| Quadrant | DetID | PixID | Counts | Sigma | Mean | Median | Sigma |
| A | 1 | 162 | 609777 | 757.47 | 3701 | 3645 | 800.2 |
| A | 15 | 174 | 281583 | 347.33 | 3701 | 3645 | 800.2 |
| A | 12 | 189 | 171301 | 209.52 | 3701 | 3645 | 800.2 |
| B | 4 | 239 | 8227806 | 12614.09 | 3449 | 3361 | 652.0 |
| B | 0 | 85 | 2960312 | 4535.17 | 3449 | 3361 | 652.0 |
| B | 3 | 64 | 648555 | 989.55 | 3449 | 3361 | 652.0 |
| C | 3 | 233 | 56774 | 66.51 | 3612 | 3564 | 800.1 |
| C | 4 | 112 | 27866 | 30.37 | 3612 | 3564 | 800.1 |
| C | 13 | 61 | 21506 | 22.43 | 3612 | 3564 | 800.1 |
| D | 1 | 52 | 11782963 | 14589.39 | 3468 | 3351 | 807.4 |
| D | 4 | 95 | 802434 | 989.69 | 3468 | 3351 | 807.4 |
| D | 8 | 195 | 448782 | 551.68 | 3468 | 3351 | 807.4 |
Histogram calculated using DETX and DETY for each event in the final _common_clean file
| Quadrant A | 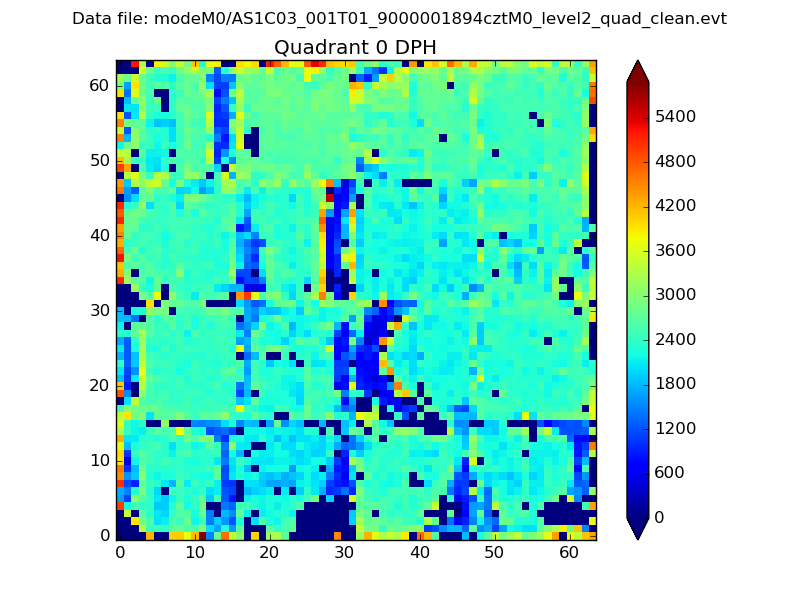 |
 |
Quadrant B |
|---|---|---|---|
| Quadrant D |  |
 |
Quadrant C |
| Plot type | Count rate plots | Images |
|---|---|---|
| Comparison with Poisson distribution Blue bars denote a histogram of data divided into 1 sec bins. Red curve is a Poisson curve with rate = median count rate of data. |
 |
 |
| Quadrant-wise count rates Data is divided into 100 sec bins |
 |
|
| Module-wise count rates for Quadrant A Data is divided into 100 sec bins |
 |
 |
| Module-wise count rates for Quadrant B Data is divided into 100 sec bins |
 |
 |
| Module-wise count rates for Quadrant C Data is divided into 100 sec bins |
 |
 |
| Module-wise count rates for Quadrant D Data is divided into 100 sec bins |
 |
 |
| Parameter | Plot |
|---|---|
| CZT HV Monitor |  |
| D_VDD |  |
| Temperature 1 | 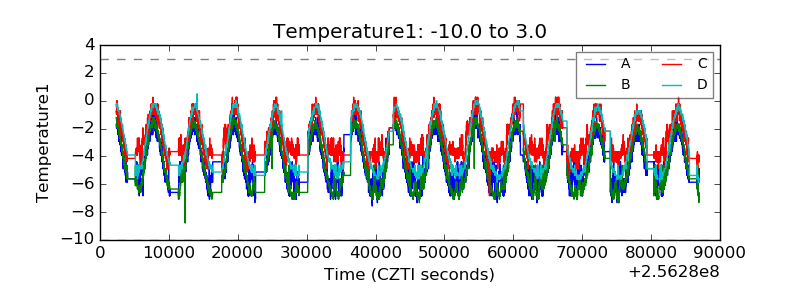 |
| Veto HV Monitor |  |
| Veto LLD |  |
| Alpha Counter |  |
| _CPM_Rate |  |
| CZT Counter |  |
| +2.5 Volts monitor | 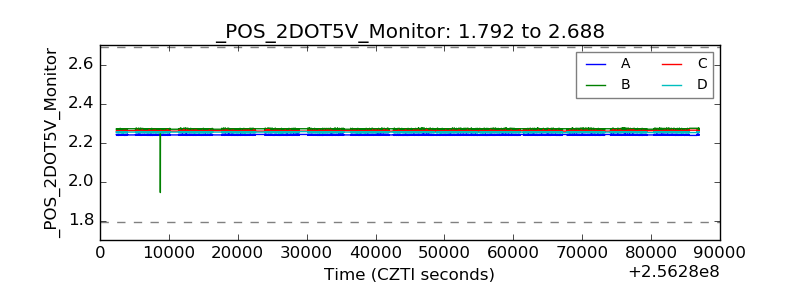 |
| +5 Volts monitor |  |
| _ROLL_ROT |  |
| _Roll_DEC |  |
| _Roll_RA | 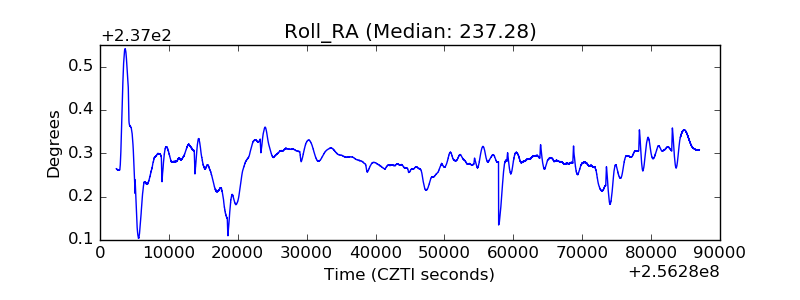 |
| Veto Counter |  |