| Param | Original file | Final file |
|---|---|---|
| Filename | modeM0/AS1G08_041T01_9000001892cztM0_level2_bc.evt | modeM0/AS1G08_041T01_9000001892cztM0_level2_quad_clean.evt |
| Size (bytes) | 2,493,552,960 | 690,520,320 |
| Size | 2.3 GB | 658.5 MB |
| Events in quadrant A | 11,960,270 | 4,483,660 |
| Events in quadrant B | 30,233,718 | 4,000,591 |
| Events in quadrant C | 10,766,021 | 4,481,910 |
| Events in quadrant D | 18,839,486 | 4,205,642 |
| Mode SS | |||
|---|---|---|---|
| Quadrant | BADHDUFLAG | Total packets | Discarded packets |
| A | 0 | 1110 | 0 |
| B | 0 | 1110 | 0 |
| C | 0 | 1110 | 0 |
| D | 0 | 1110 | 0 |
| Mode M9 | |||
|---|---|---|---|
| Quadrant | BADHDUFLAG | Total packets | Discarded packets |
| A | 0 | 72 | 0 |
| B | 0 | 72 | 0 |
| C | 0 | 72 | 0 |
| D | 0 | 72 | 0 |
| Mode M0 | |||
|---|---|---|---|
| Quadrant | BADHDUFLAG | Total packets | Discarded packets |
| A | 0 | 115909 | 0 |
| B | 0 | 201223 | 0 |
| C | 0 | 111643 | 0 |
| D | 0 | 140879 | 0 |
| Quadrant | Total seconds | Saturated seconds | Saturation percentage |
|---|---|---|---|
| A | 54516 | 812 | 1.489471% |
| B | 54516 | 11773 | 21.595495% |
| C | 54516 | 422 | 0.774085% |
| D | 54516 | 2454 | 4.501431% |
Noise dominated data is calculated using 1-second bins in cleaned event files. If a bin has >2000 counts, and if more than 50% of those come from <1% of pixels, then it is considered to be noise-dominated and hence unusable.
| Quadrant | # 1 sec bins | Bins with >0 counts | Bins with >2000 counts | High rate bins dominated by noise | Noise dominated (total time) | Noise dominated (detector-on time) | Marked lightcurve |
|---|---|---|---|---|---|---|---|
| A | 61722 | 54523 | 8 | 8 | 0.01% | 0.01% |  |
| B | 61722 | 54471 | 521 | 521 | 0.84% | 0.96% |  |
| C | 61722 | 54521 | 0 | 0 | 0.00% | 0.00% |  |
| D | 61722 | 54520 | 265 | 265 | 0.43% | 0.49% |  |
Top three noisy pixels from each quadrant. If the there are fewer than three noisy pixels in the level2.evt file, extra rows are filled as -1
| Pixel properties | Quadrant properties | ||||||
|---|---|---|---|---|---|---|---|
| Quadrant | DetID | PixID | Counts | Sigma | Mean | Median | Sigma |
| A | 13 | 248 | 387899 | 630.28 | 2782 | 2724 | 611.1 |
| A | 12 | 189 | 210787 | 340.46 | 2782 | 2724 | 611.1 |
| A | 15 | 174 | 201253 | 324.86 | 2782 | 2724 | 611.1 |
| B | 0 | 85 | 11952166 | 24887.71 | 2489 | 2421 | 480.1 |
| B | 4 | 239 | 5877810 | 12236.66 | 2489 | 2421 | 480.1 |
| B | 0 | 219 | 1069318 | 2222.02 | 2489 | 2421 | 480.1 |
| C | 4 | 112 | 19524 | 27.82 | 2738 | 2708 | 604.4 |
| C | 13 | 61 | 16467 | 22.77 | 2738 | 2708 | 604.4 |
| C | 8 | 128 | 16354 | 22.58 | 2738 | 2708 | 604.4 |
| D | 1 | 52 | 6262537 | 9931.34 | 2706 | 2610 | 630.3 |
| D | 8 | 195 | 669411 | 1057.88 | 2706 | 2610 | 630.3 |
| D | 4 | 95 | 579860 | 915.8 | 2706 | 2610 | 630.3 |
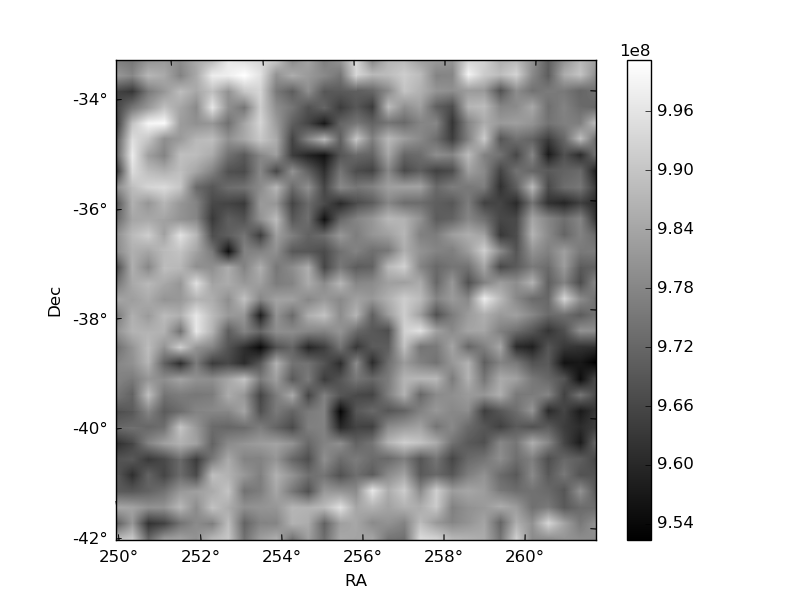
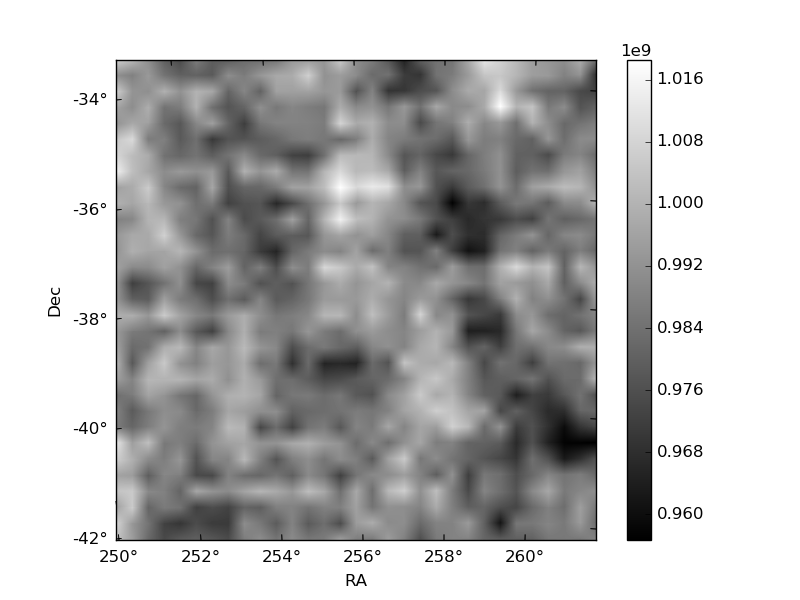
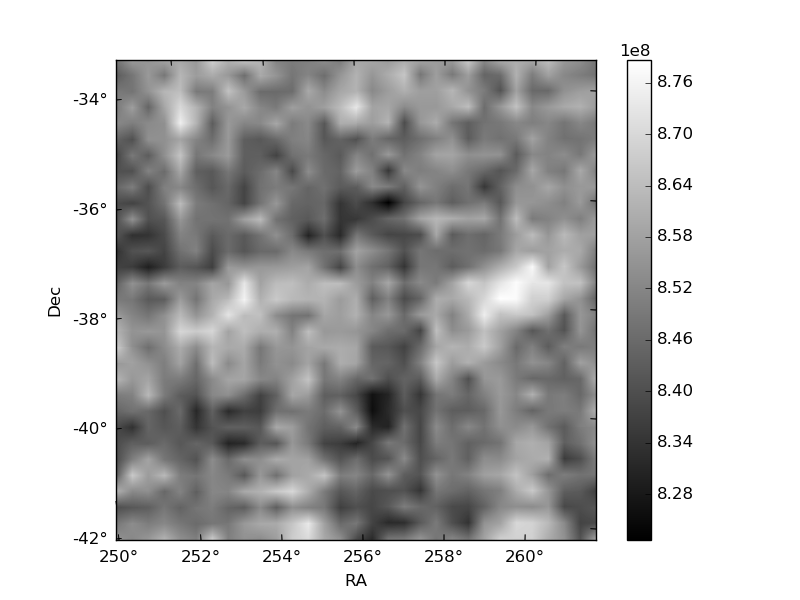
Histogram calculated using DETX and DETY for each event in the final _common_clean file
| Quadrant A |  |
 |
Quadrant B |
|---|---|---|---|
| Quadrant D |  |
 |
Quadrant C |
| Plot type | Count rate plots | Images |
|---|---|---|
| Comparison with Poisson distribution Blue bars denote a histogram of data divided into 1 sec bins. Red curve is a Poisson curve with rate = median count rate of data. |
 |
 |
| Quadrant-wise count rates Data is divided into 100 sec bins |
 |
|
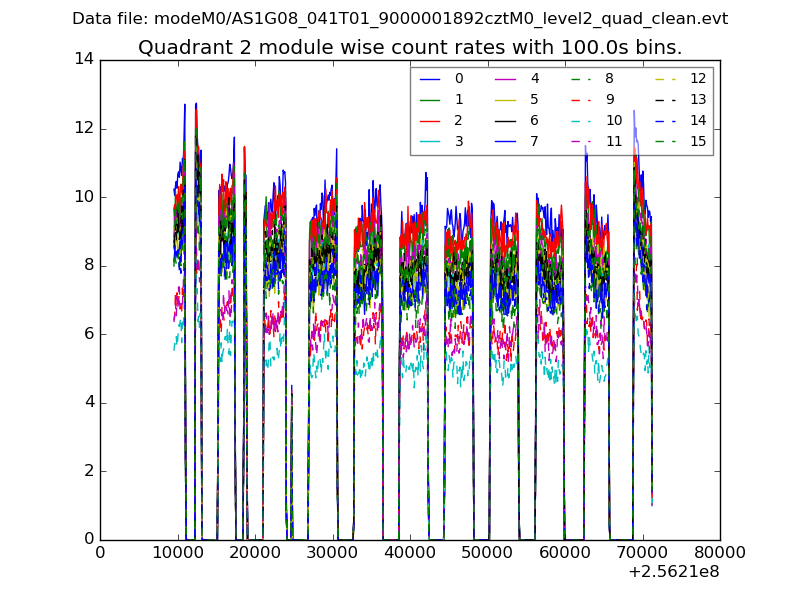
| Module-wise count rates for Quadrant A Data is divided into 100 sec bins |
 |
 |
| Module-wise count rates for Quadrant B Data is divided into 100 sec bins |
 |
 |
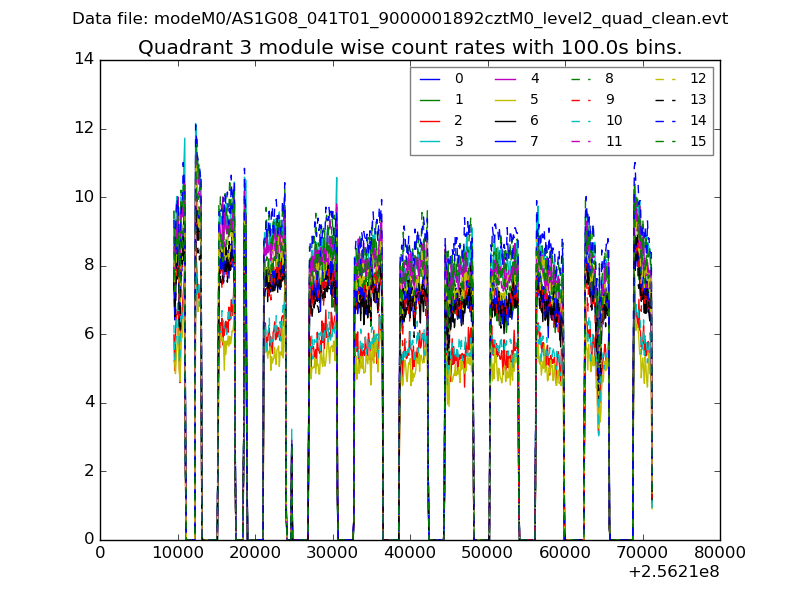
| Module-wise count rates for Quadrant C Data is divided into 100 sec bins |
 |
 |
| Module-wise count rates for Quadrant D Data is divided into 100 sec bins |
 |
 |
| Parameter | Plot |
|---|---|
| CZT HV Monitor |  |
| D_VDD |  |
| Temperature 1 |  |
| Veto HV Monitor |  |
| Veto LLD |  |
| Alpha Counter |  |
| _CPM_Rate |  |
| CZT Counter |  |
| +2.5 Volts monitor |  |
| +5 Volts monitor |  |
| _ROLL_ROT |  |
| _Roll_DEC | 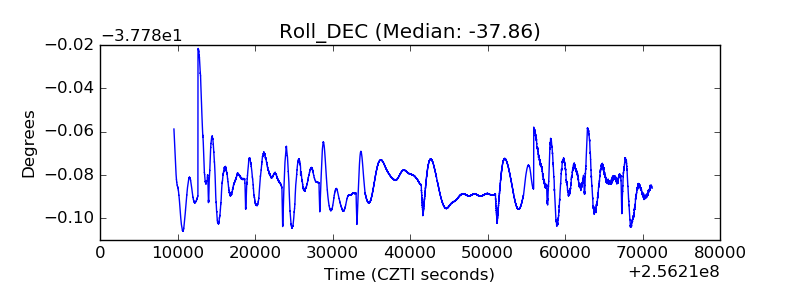 |
| _Roll_RA | 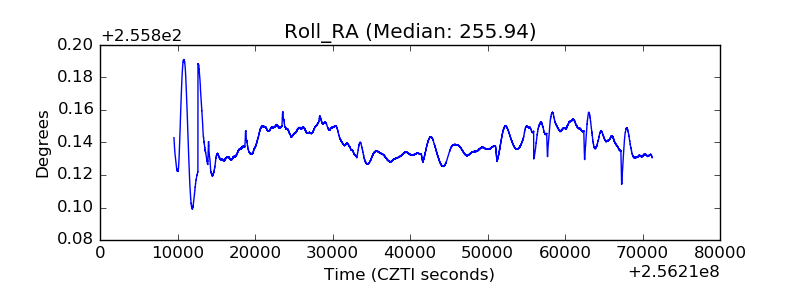 |
| Veto Counter |  |