| Param | Original file | Final file |
|---|---|---|
| Filename | modeM0/AS1A04_048T01_9000001890cztM0_level2_bc.evt | modeM0/AS1A04_048T01_9000001890cztM0_level2_quad_clean.evt |
| Size (bytes) | 2,523,193,920 | 763,153,920 |
| Size | 2.3 GB | 727.8 MB |
| Events in quadrant A | 13,915,631 | 4,823,133 |
| Events in quadrant B | 25,556,762 | 4,568,781 |
| Events in quadrant C | 12,706,372 | 4,837,303 |
| Events in quadrant D | 19,951,078 | 4,573,375 |
| Mode SS | |||
|---|---|---|---|
| Quadrant | BADHDUFLAG | Total packets | Discarded packets |
| A | 0 | 1278 | 0 |
| B | 0 | 1278 | 0 |
| C | 0 | 1278 | 0 |
| D | 0 | 1278 | 0 |
| Mode M0 | |||
|---|---|---|---|
| Quadrant | BADHDUFLAG | Total packets | Discarded packets |
| A | 0 | 133341 | 0 |
| B | 0 | 189454 | 0 |
| C | 0 | 129100 | 0 |
| D | 0 | 152453 | 0 |
| Mode M9 | |||
|---|---|---|---|
| Quadrant | BADHDUFLAG | Total packets | Discarded packets |
| A | 0 | 88 | 0 |
| B | 0 | 88 | 0 |
| C | 0 | 88 | 0 |
| D | 0 | 88 | 0 |
| Quadrant | Total seconds | Saturated seconds | Saturation percentage |
|---|---|---|---|
| A | 62854 | 734 | 1.167786% |
| B | 62854 | 7640 | 12.155153% |
| C | 62854 | 368 | 0.585484% |
| D | 62854 | 2545 | 4.049066% |
Noise dominated data is calculated using 1-second bins in cleaned event files. If a bin has >2000 counts, and if more than 50% of those come from <1% of pixels, then it is considered to be noise-dominated and hence unusable.
| Quadrant | # 1 sec bins | Bins with >0 counts | Bins with >2000 counts | High rate bins dominated by noise | Noise dominated (total time) | Noise dominated (detector-on time) | Marked lightcurve |
|---|---|---|---|---|---|---|---|
| A | 71635 | 62857 | 3 | 3 | 0.00% | 0.00% |  |
| B | 71635 | 62841 | 330 | 330 | 0.46% | 0.53% |  |
| C | 71635 | 62855 | 2 | 2 | 0.00% | 0.00% |  |
| D | 71635 | 62856 | 1234 | 1234 | 1.72% | 1.96% |  |
Top three noisy pixels from each quadrant. If the there are fewer than three noisy pixels in the level2.evt file, extra rows are filled as -1
| Pixel properties | Quadrant properties | ||||||
|---|---|---|---|---|---|---|---|
| Quadrant | DetID | PixID | Counts | Sigma | Mean | Median | Sigma |
| A | 12 | 189 | 1013839 | 1430.54 | 3263 | 3199 | 706.5 |
| A | 8 | 15 | 105283 | 144.5 | 3263 | 3199 | 706.5 |
| A | 15 | 222 | 94694 | 129.51 | 3263 | 3199 | 706.5 |
| B | 4 | 239 | 8214230 | 14211.85 | 3078 | 3002 | 577.8 |
| B | 0 | 85 | 2390172 | 4131.67 | 3078 | 3002 | 577.8 |
| B | 3 | 64 | 934301 | 1611.88 | 3078 | 3002 | 577.8 |
| C | 14 | 234 | 69023 | 92.76 | 3231 | 3190 | 709.7 |
| C | 13 | 61 | 19151 | 22.49 | 3231 | 3190 | 709.7 |
| C | 4 | 112 | 11387 | 11.55 | 3231 | 3190 | 709.7 |
| D | 1 | 52 | 6307971 | 8686.69 | 3187 | 3084 | 725.8 |
| D | 10 | 157 | 500834 | 685.79 | 3187 | 3084 | 725.8 |
| D | 4 | 95 | 482522 | 660.56 | 3187 | 3084 | 725.8 |
Histogram calculated using DETX and DETY for each event in the final _common_clean file
| Quadrant A | 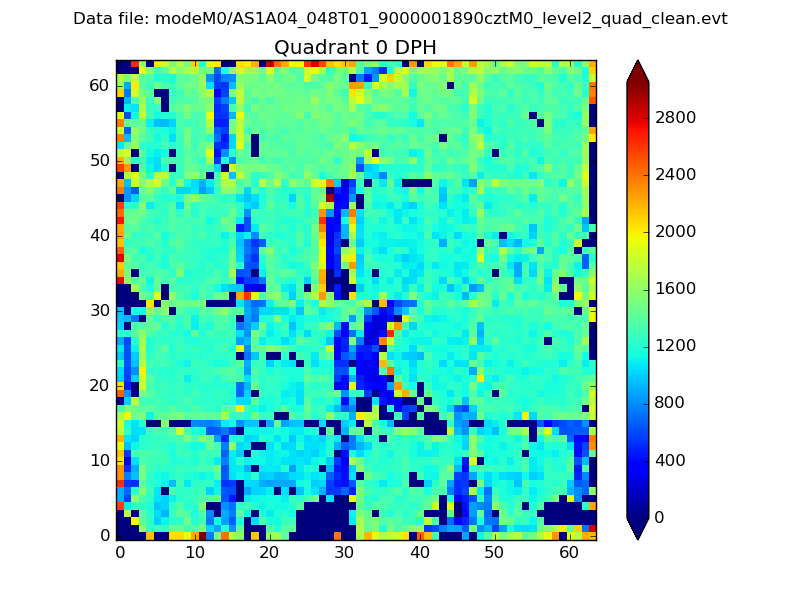 |
 |
Quadrant B |
|---|---|---|---|
| Quadrant D |  |
 |
Quadrant C |
| Plot type | Count rate plots | Images |
|---|---|---|
| Comparison with Poisson distribution Blue bars denote a histogram of data divided into 1 sec bins. Red curve is a Poisson curve with rate = median count rate of data. |
 |
 |
| Quadrant-wise count rates Data is divided into 100 sec bins |
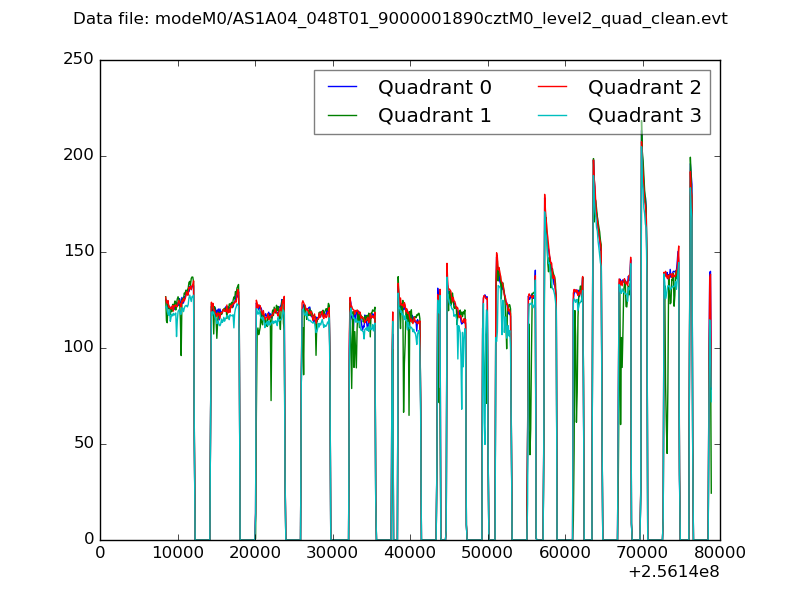 |
|
| Module-wise count rates for Quadrant A Data is divided into 100 sec bins |
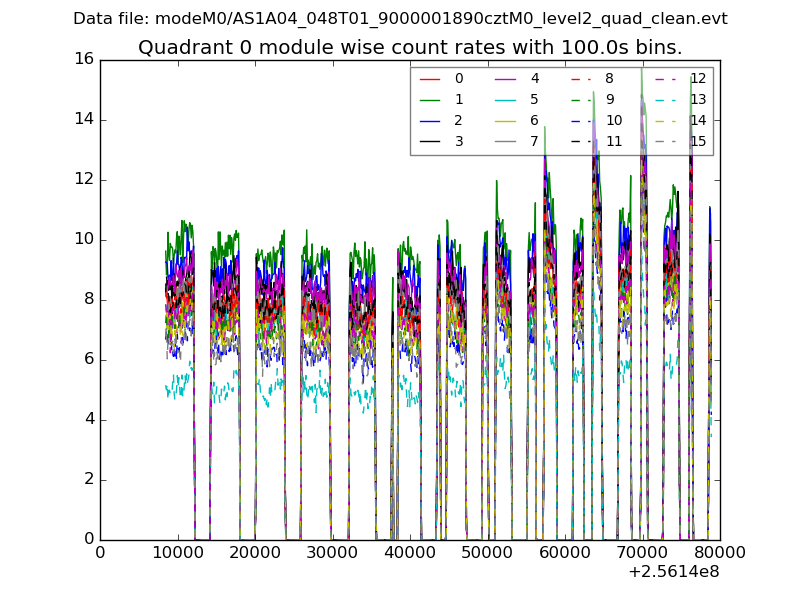 |
 |
| Module-wise count rates for Quadrant B Data is divided into 100 sec bins |
 |
 |
| Module-wise count rates for Quadrant C Data is divided into 100 sec bins |
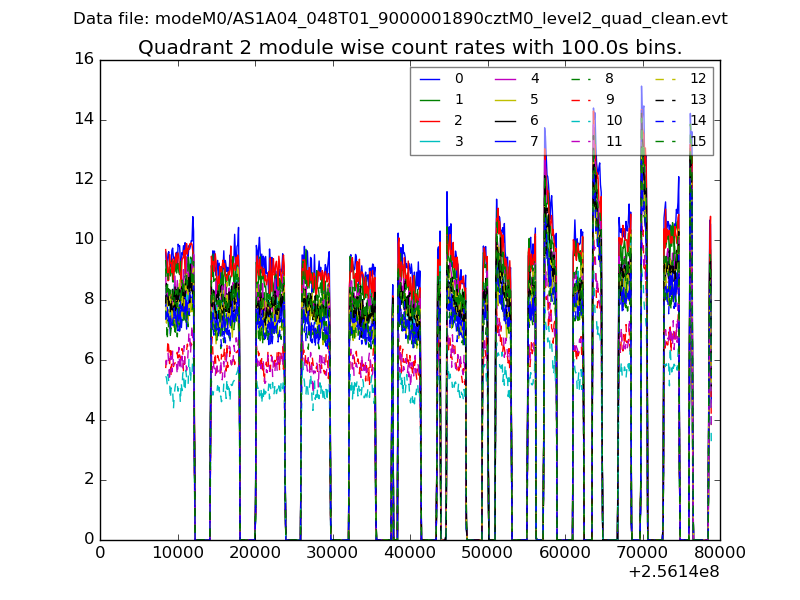 |
 |
| Module-wise count rates for Quadrant D Data is divided into 100 sec bins |
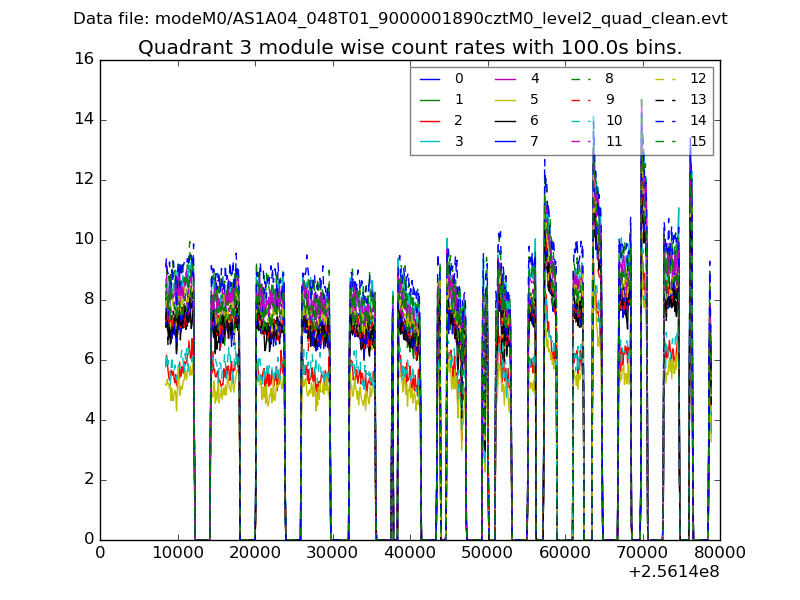 |
 |
| Parameter | Plot |
|---|---|
| CZT HV Monitor | 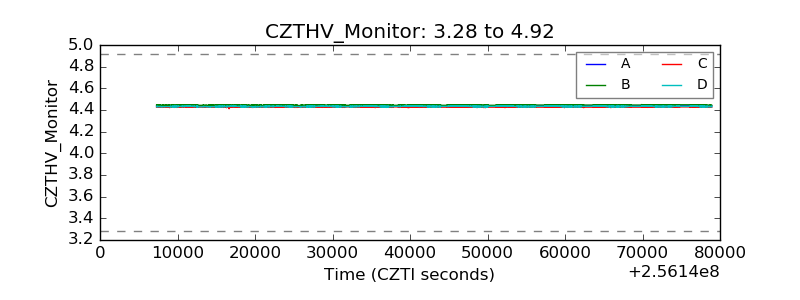 |
| D_VDD |  |
| Temperature 1 |  |
| Veto HV Monitor |  |
| Veto LLD | 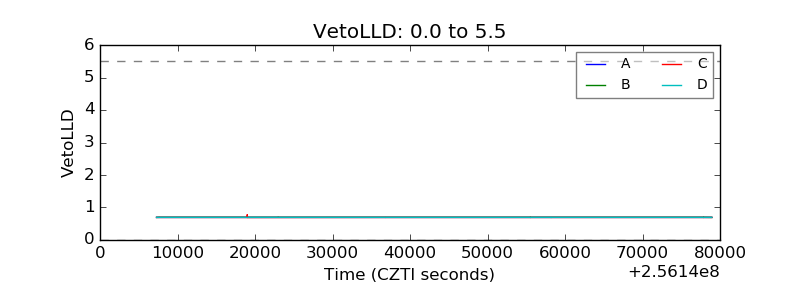 |
| Alpha Counter | 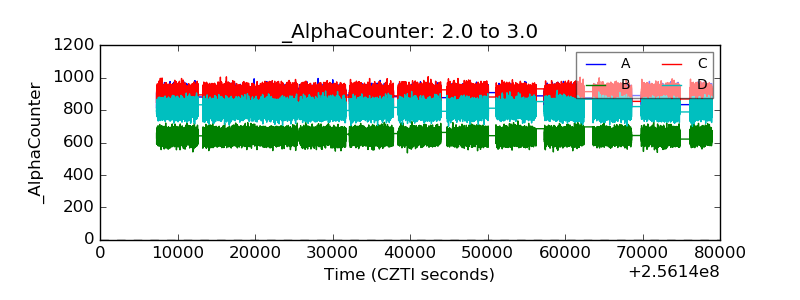 |
| _CPM_Rate |  |
| CZT Counter |  |
| +2.5 Volts monitor |  |
| +5 Volts monitor |  |
| _ROLL_ROT | 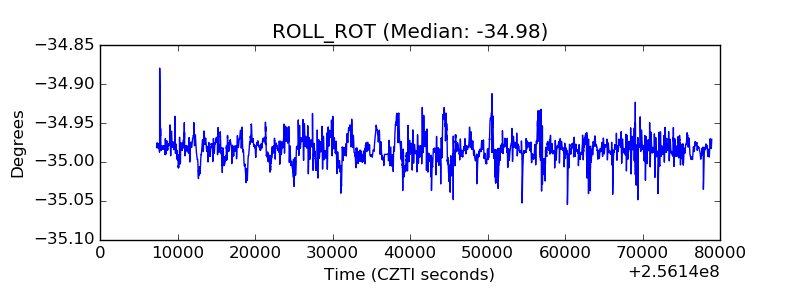 |
| _Roll_DEC |  |
| _Roll_RA |  |
| Veto Counter |  |