| Param | Original file | Final file |
|---|---|---|
| Filename | modeM0/AS1G08_071T01_9000001888cztM0_level2_bc.evt | modeM0/AS1G08_071T01_9000001888cztM0_level2_quad_clean.evt |
| Size (bytes) | 11,321,300,160 | 4,018,798,080 |
| Size | 10.5 GB | 3.7 GB |
| Events in quadrant A | 69,022,341 | 25,569,544 |
| Events in quadrant B | 104,393,994 | 24,926,602 |
| Events in quadrant C | 61,684,795 | 25,665,551 |
| Events in quadrant D | 86,923,820 | 24,597,067 |
| Mode SS | |||
|---|---|---|---|
| Quadrant | BADHDUFLAG | Total packets | Discarded packets |
| A | 0 | 6240 | 0 |
| B | 0 | 6240 | 0 |
| C | 0 | 6240 | 0 |
| D | 0 | 6240 | 0 |
| Mode M0 | |||
|---|---|---|---|
| Quadrant | BADHDUFLAG | Total packets | Discarded packets |
| A | 0 | 650293 | 0 |
| B | 0 | 806464 | 0 |
| C | 0 | 629962 | 0 |
| D | 0 | 716537 | 0 |
| Mode M9 | |||
|---|---|---|---|
| Quadrant | BADHDUFLAG | Total packets | Discarded packets |
| A | 0 | 503 | 0 |
| B | 0 | 503 | 0 |
| C | 0 | 503 | 0 |
| D | 0 | 503 | 0 |
| Quadrant | Total seconds | Saturated seconds | Saturation percentage |
|---|---|---|---|
| A | 306147 | 3218 | 1.051129% |
| B | 306147 | 21401 | 6.990433% |
| C | 306147 | 2402 | 0.784590% |
| D | 306147 | 8141 | 2.659180% |
Noise dominated data is calculated using 1-second bins in cleaned event files. If a bin has >2000 counts, and if more than 50% of those come from <1% of pixels, then it is considered to be noise-dominated and hence unusable.
| Quadrant | # 1 sec bins | Bins with >0 counts | Bins with >2000 counts | High rate bins dominated by noise | Noise dominated (total time) | Noise dominated (detector-on time) | Marked lightcurve |
|---|---|---|---|---|---|---|---|
| A | 356849 | 306157 | 8 | 8 | 0.00% | 0.00% |  |
| B | 356849 | 306136 | 1409 | 1409 | 0.39% | 0.46% |  |
| C | 356849 | 306156 | 3 | 3 | 0.00% | 0.00% |  |
| D | 356849 | 306149 | 892 | 892 | 0.25% | 0.29% |  |
Top three noisy pixels from each quadrant. If the there are fewer than three noisy pixels in the level2.evt file, extra rows are filled as -1
| Pixel properties | Quadrant properties | ||||||
|---|---|---|---|---|---|---|---|
| Quadrant | DetID | PixID | Counts | Sigma | Mean | Median | Sigma |
| A | 12 | 189 | 4846141 | 1401.3 | 15968 | 15669 | 3447.1 |
| A | 15 | 222 | 1900352 | 546.74 | 15968 | 15669 | 3447.1 |
| A | 8 | 15 | 701485 | 198.95 | 15968 | 15669 | 3447.1 |
| B | 4 | 239 | 23179013 | 7961.86 | 15592 | 15190 | 2909.3 |
| B | 0 | 219 | 5460117 | 1871.53 | 15592 | 15190 | 2909.3 |
| B | 4 | 206 | 4773689 | 1635.59 | 15592 | 15190 | 2909.3 |
| C | 14 | 234 | 227675 | 62.19 | 15655 | 15451 | 3412.6 |
| C | 3 | 233 | 97744 | 24.11 | 15655 | 15451 | 3412.6 |
| C | 13 | 61 | 93393 | 22.84 | 15655 | 15451 | 3412.6 |
| D | 1 | 52 | 15893114 | 4317.26 | 15636 | 15083 | 3677.8 |
| D | 8 | 195 | 4868424 | 1319.63 | 15636 | 15083 | 3677.8 |
| D | 13 | 172 | 1596494 | 429.99 | 15636 | 15083 | 3677.8 |
Histogram calculated using DETX and DETY for each event in the final _common_clean file
| Quadrant A |  |
 |
Quadrant B |
|---|---|---|---|
| Quadrant D |  |
 |
Quadrant C |
| Plot type | Count rate plots | Images |
|---|---|---|
| Comparison with Poisson distribution Blue bars denote a histogram of data divided into 1 sec bins. Red curve is a Poisson curve with rate = median count rate of data. |
 |
 |
| Quadrant-wise count rates Data is divided into 100 sec bins |
 |
|
| Module-wise count rates for Quadrant A Data is divided into 100 sec bins |
 |
 |
| Module-wise count rates for Quadrant B Data is divided into 100 sec bins |
 |
 |
| Module-wise count rates for Quadrant C Data is divided into 100 sec bins |
 |
 |
| Module-wise count rates for Quadrant D Data is divided into 100 sec bins |
 |
 |
| Parameter | Plot |
|---|---|
| CZT HV Monitor |  |
| D_VDD |  |
| Temperature 1 |  |
| Veto HV Monitor |  |
| Veto LLD |  |
| Alpha Counter |  |
| _CPM_Rate |  |
| CZT Counter |  |
| +2.5 Volts monitor |  |
| +5 Volts monitor | 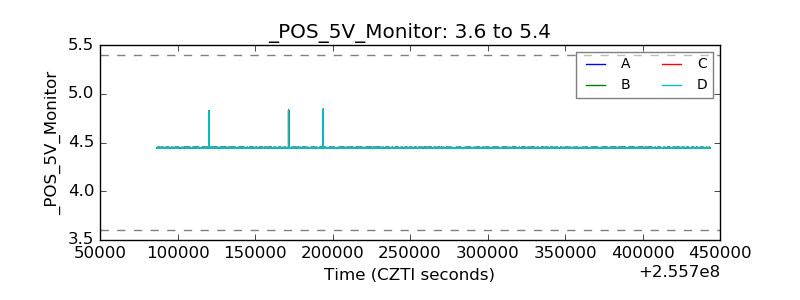 |
| _ROLL_ROT |  |
| _Roll_DEC |  |
| _Roll_RA |  |
| Veto Counter |  |