| Param | Original file | Final file |
|---|---|---|
| Filename | modeM0/AS1A04_112T01_9000001884cztM0_level2_bc.evt | modeM0/AS1A04_112T01_9000001884cztM0_level2_quad_clean.evt |
| Size (bytes) | 1,641,859,200 | 695,704,320 |
| Size | 1.5 GB | 663.5 MB |
| Events in quadrant A | 10,030,155 | 4,770,179 |
| Events in quadrant B | 13,887,774 | 4,616,539 |
| Events in quadrant C | 9,162,539 | 4,683,283 |
| Events in quadrant D | 14,017,997 | 4,359,486 |
| Mode SS | |||
|---|---|---|---|
| Quadrant | BADHDUFLAG | Total packets | Discarded packets |
| A | 0 | 784 | 0 |
| B | 0 | 784 | 0 |
| C | 0 | 784 | 0 |
| D | 0 | 784 | 0 |
| Mode M0 | |||
|---|---|---|---|
| Quadrant | BADHDUFLAG | Total packets | Discarded packets |
| A | 0 | 84820 | 0 |
| B | 0 | 103939 | 0 |
| C | 0 | 83773 | 0 |
| D | 0 | 102510 | 0 |
| Mode M9 | |||
|---|---|---|---|
| Quadrant | BADHDUFLAG | Total packets | Discarded packets |
| A | 0 | 85 | 0 |
| B | 0 | 85 | 0 |
| C | 0 | 85 | 0 |
| D | 0 | 85 | 0 |
| Quadrant | Total seconds | Saturated seconds | Saturation percentage |
|---|---|---|---|
| A | 38488 | 562 | 1.460195% |
| B | 38488 | 3223 | 8.374039% |
| C | 38488 | 526 | 1.366660% |
| D | 38488 | 2315 | 6.014862% |
Noise dominated data is calculated using 1-second bins in cleaned event files. If a bin has >2000 counts, and if more than 50% of those come from <1% of pixels, then it is considered to be noise-dominated and hence unusable.
| Quadrant | # 1 sec bins | Bins with >0 counts | Bins with >2000 counts | High rate bins dominated by noise | Noise dominated (total time) | Noise dominated (detector-on time) | Marked lightcurve |
|---|---|---|---|---|---|---|---|
| A | 46395 | 38491 | 20 | 20 | 0.04% | 0.05% |  |
| B | 46395 | 38485 | 367 | 367 | 0.79% | 0.95% |  |
| C | 46394 | 38488 | 22 | 22 | 0.05% | 0.06% |  |
| D | 46394 | 38487 | 261 | 261 | 0.56% | 0.68% |  |
Top three noisy pixels from each quadrant. If the there are fewer than three noisy pixels in the level2.evt file, extra rows are filled as -1
| Pixel properties | Quadrant properties | ||||||
|---|---|---|---|---|---|---|---|
| Quadrant | DetID | PixID | Counts | Sigma | Mean | Median | Sigma |
| A | 0 | 23 | 971278 | 2188.56 | 2029 | 1993 | 442.9 |
| A | 12 | 189 | 491883 | 1106.13 | 2029 | 1993 | 442.9 |
| A | 15 | 239 | 359718 | 807.71 | 2029 | 1993 | 442.9 |
| B | 4 | 239 | 5009071 | 13615.26 | 1967 | 1921 | 367.8 |
| B | 0 | 85 | 317736 | 858.75 | 1967 | 1921 | 367.8 |
| B | 3 | 64 | 275438 | 743.74 | 1967 | 1921 | 367.8 |
| C | 15 | 208 | 1464836 | 3406.66 | 1954 | 1931 | 429.4 |
| C | 12 | 4 | 36430 | 80.34 | 1954 | 1931 | 429.4 |
| C | 14 | 234 | 15731 | 32.13 | 1954 | 1931 | 429.4 |
| D | 1 | 52 | 4539452 | 10193.72 | 1918 | 1858 | 445.1 |
| D | 8 | 195 | 764918 | 1714.22 | 1918 | 1858 | 445.1 |
| D | 2 | 136 | 358403 | 800.98 | 1918 | 1858 | 445.1 |
Histogram calculated using DETX and DETY for each event in the final _common_clean file
| Quadrant A |  |
 |
Quadrant B |
|---|---|---|---|
| Quadrant D |  |
 |
Quadrant C |
| Plot type | Count rate plots | Images |
|---|---|---|
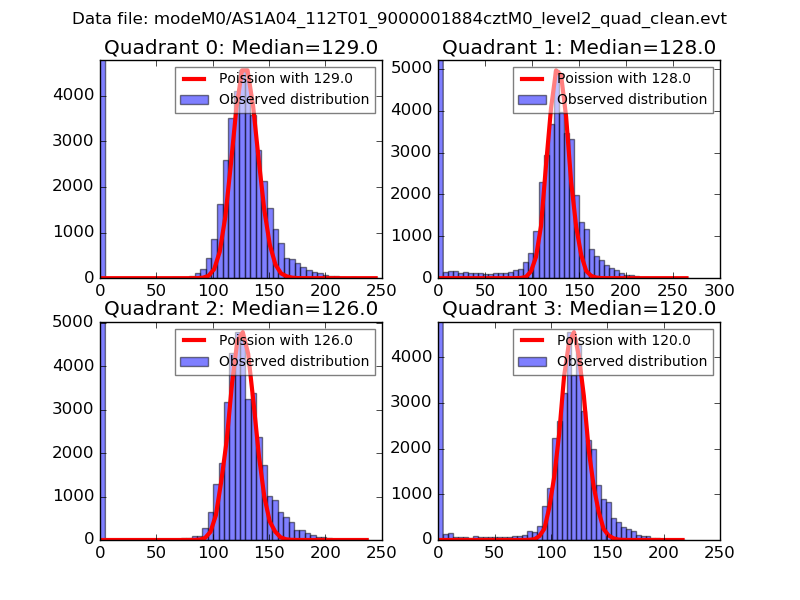
| Comparison with Poisson distribution Blue bars denote a histogram of data divided into 1 sec bins. Red curve is a Poisson curve with rate = median count rate of data. |
 |
 |
| Quadrant-wise count rates Data is divided into 100 sec bins |
 |
|
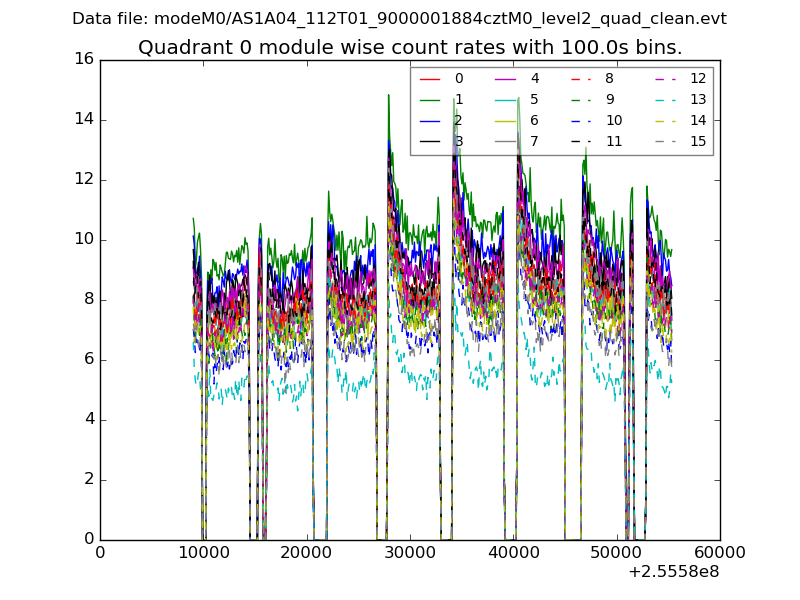
| Module-wise count rates for Quadrant A Data is divided into 100 sec bins |
 |
 |
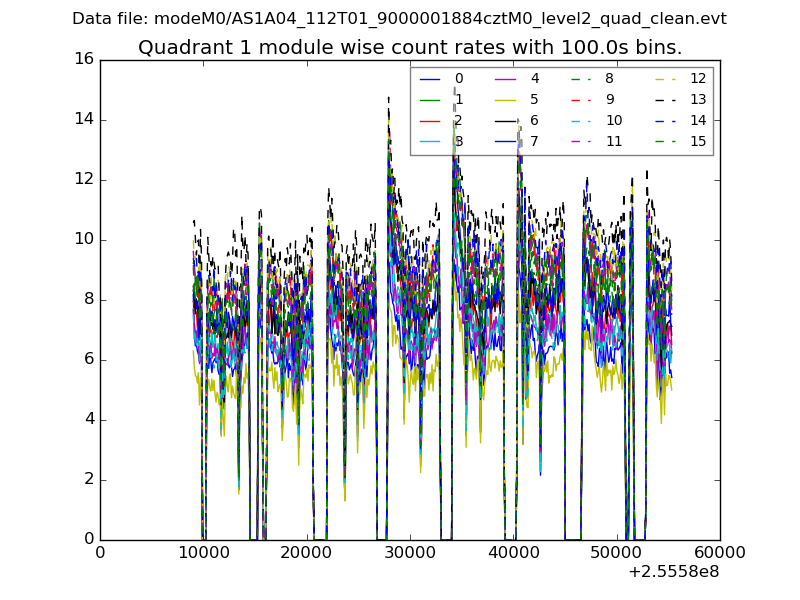
| Module-wise count rates for Quadrant B Data is divided into 100 sec bins |
 |
 |
| Module-wise count rates for Quadrant C Data is divided into 100 sec bins |
 |
 |
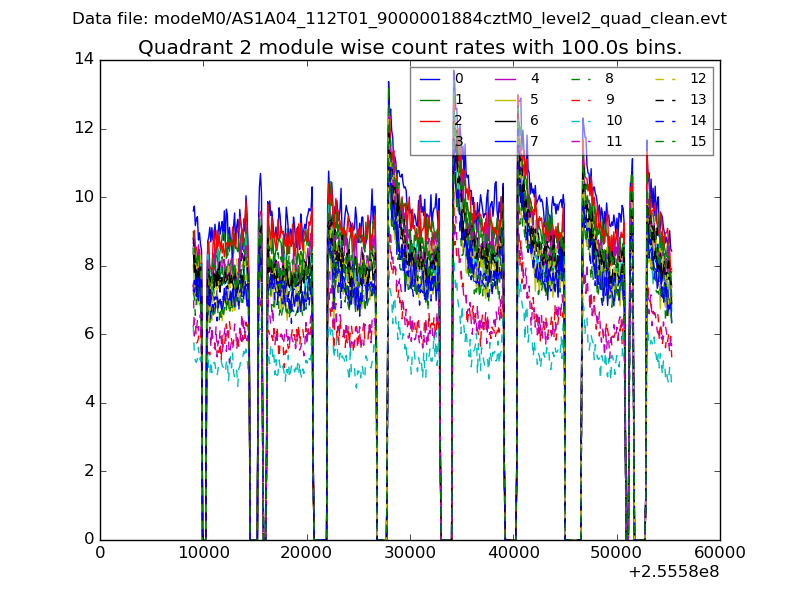
| Module-wise count rates for Quadrant D Data is divided into 100 sec bins |
 |
 |
| Parameter | Plot |
|---|---|
| CZT HV Monitor |  |
| D_VDD | 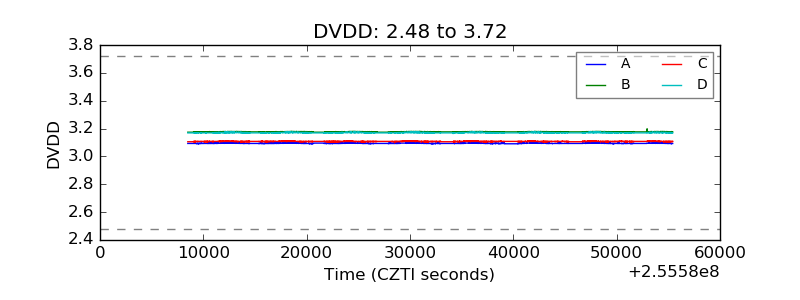 |
| Temperature 1 |  |
| Veto HV Monitor |  |
| Veto LLD |  |
| Alpha Counter |  |
| _CPM_Rate |  |
| CZT Counter | 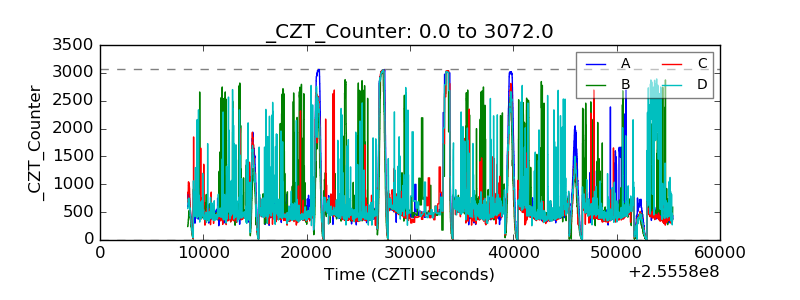 |
| +2.5 Volts monitor |  |
| +5 Volts monitor |  |
| _ROLL_ROT |  |
| _Roll_DEC |  |
| _Roll_RA |  |
| Veto Counter |  |