| Param | Original file | Final file |
|---|---|---|
| Filename | modeM0/AS1A04_044T01_9000001882cztM0_level2_bc.evt | modeM0/AS1A04_044T01_9000001882cztM0_level2_quad_clean.evt |
| Size (bytes) | 2,852,300,160 | 839,928,960 |
| Size | 2.7 GB | 801.0 MB |
| Events in quadrant A | 20,838,448 | 5,306,933 |
| Events in quadrant B | 21,721,063 | 5,122,649 |
| Events in quadrant C | 15,504,202 | 5,411,740 |
| Events in quadrant D | 23,896,968 | 5,143,890 |
| Mode M0 | |||
|---|---|---|---|
| Quadrant | BADHDUFLAG | Total packets | Discarded packets |
| A | 0 | 158914 | 0 |
| B | 0 | 170861 | 0 |
| C | 0 | 144536 | 0 |
| D | 0 | 167860 | 0 |
| Mode M9 | |||
|---|---|---|---|
| Quadrant | BADHDUFLAG | Total packets | Discarded packets |
| A | 0 | 105 | 0 |
| B | 0 | 105 | 0 |
| C | 0 | 105 | 0 |
| D | 0 | 105 | 0 |
| Mode SS | |||
|---|---|---|---|
| Quadrant | BADHDUFLAG | Total packets | Discarded packets |
| A | 0 | 1322 | 0 |
| B | 0 | 1322 | 0 |
| C | 0 | 1322 | 0 |
| D | 0 | 1322 | 0 |
| Quadrant | Total seconds | Saturated seconds | Saturation percentage |
|---|---|---|---|
| A | 64945 | 1367 | 2.104858% |
| B | 64945 | 4927 | 7.586419% |
| C | 64945 | 1510 | 2.325044% |
| D | 64945 | 2137 | 3.290477% |
Noise dominated data is calculated using 1-second bins in cleaned event files. If a bin has >2000 counts, and if more than 50% of those come from <1% of pixels, then it is considered to be noise-dominated and hence unusable.
| Quadrant | # 1 sec bins | Bins with >0 counts | Bins with >2000 counts | High rate bins dominated by noise | Noise dominated (total time) | Noise dominated (detector-on time) | Marked lightcurve |
|---|---|---|---|---|---|---|---|
| A | 75445 | 64947 | 194 | 194 | 0.26% | 0.30% |  |
| B | 75445 | 64944 | 458 | 458 | 0.61% | 0.71% |  |
| C | 75445 | 64917 | 137 | 137 | 0.18% | 0.21% |  |
| D | 75445 | 64945 | 552 | 552 | 0.73% | 0.85% |  |
Top three noisy pixels from each quadrant. If the there are fewer than three noisy pixels in the level2.evt file, extra rows are filled as -1
| Pixel properties | Quadrant properties | ||||||
|---|---|---|---|---|---|---|---|
| Quadrant | DetID | PixID | Counts | Sigma | Mean | Median | Sigma |
| A | 15 | 222 | 3658245 | 5100.02 | 3321 | 3253 | 716.7 |
| A | 0 | 23 | 2829013 | 3942.95 | 3321 | 3253 | 716.7 |
| A | 8 | 15 | 519853 | 720.84 | 3321 | 3253 | 716.7 |
| B | 4 | 239 | 7064147 | 11526.26 | 3254 | 3168 | 612.6 |
| B | 0 | 85 | 662806 | 1076.79 | 3254 | 3168 | 612.6 |
| B | 0 | 214 | 274048 | 442.18 | 3254 | 3168 | 612.6 |
| C | 15 | 208 | 2717535 | 3807.45 | 3262 | 3219 | 712.9 |
| C | 13 | 61 | 19297 | 22.55 | 3262 | 3219 | 712.9 |
| C | 14 | 234 | 15107 | 16.68 | 3262 | 3219 | 712.9 |
| D | 1 | 52 | 8893431 | 10819.15 | 3256 | 3152 | 821.7 |
| D | 2 | 136 | 712722 | 863.52 | 3256 | 3152 | 821.7 |
| D | 8 | 195 | 615247 | 744.9 | 3256 | 3152 | 821.7 |
Histogram calculated using DETX and DETY for each event in the final _common_clean file
| Quadrant A |  |
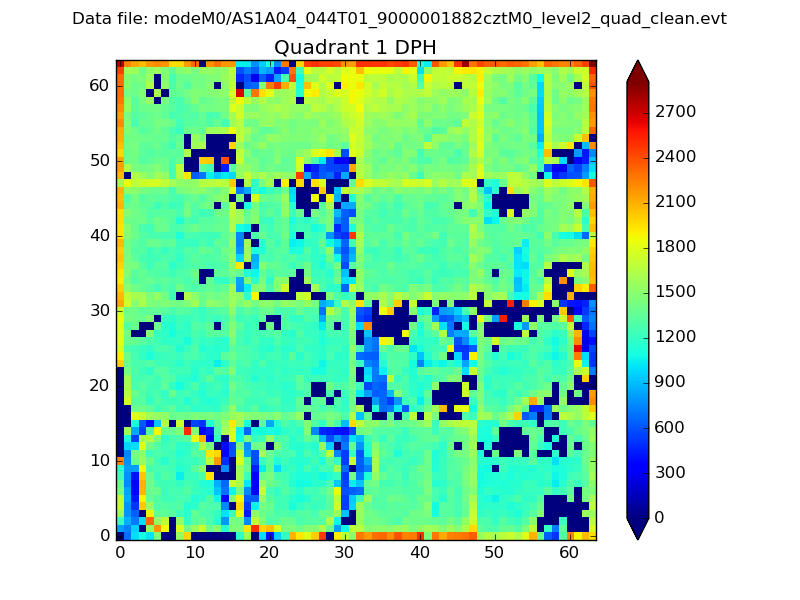 |
Quadrant B |
|---|---|---|---|
| Quadrant D |  |
 |
Quadrant C |
| Plot type | Count rate plots | Images |
|---|---|---|
| Comparison with Poisson distribution Blue bars denote a histogram of data divided into 1 sec bins. Red curve is a Poisson curve with rate = median count rate of data. |
 |
 |
| Quadrant-wise count rates Data is divided into 100 sec bins |
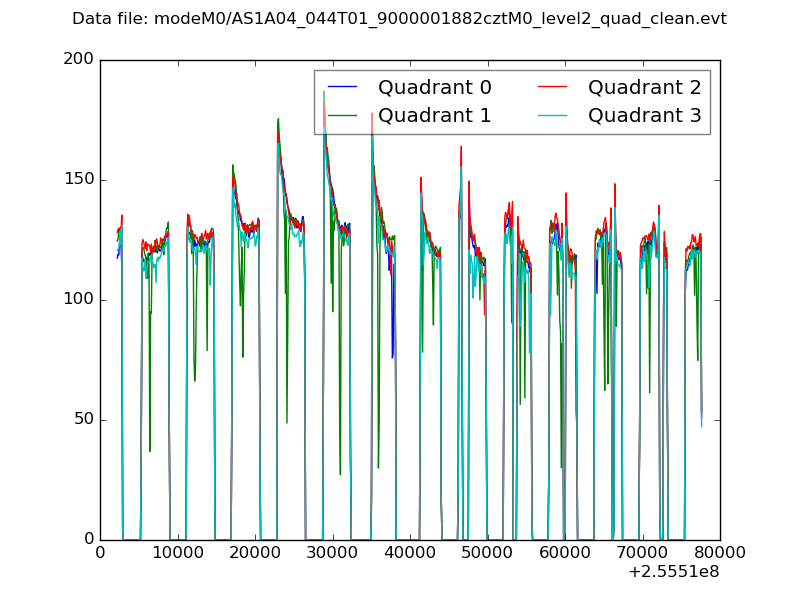 |
|
| Module-wise count rates for Quadrant A Data is divided into 100 sec bins |
 |
 |
| Module-wise count rates for Quadrant B Data is divided into 100 sec bins |
 |
 |
| Module-wise count rates for Quadrant C Data is divided into 100 sec bins |
 |
 |
| Module-wise count rates for Quadrant D Data is divided into 100 sec bins |
 |
 |
| Parameter | Plot |
|---|---|
| CZT HV Monitor |  |
| D_VDD |  |
| Temperature 1 |  |
| Veto HV Monitor | 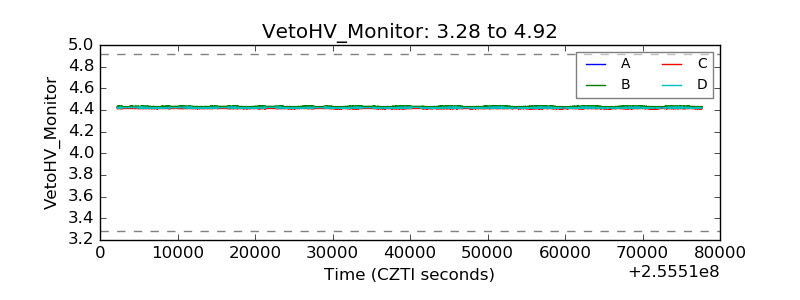 |
| Veto LLD |  |
| Alpha Counter |  |
| _CPM_Rate |  |
| CZT Counter |  |
| +2.5 Volts monitor | 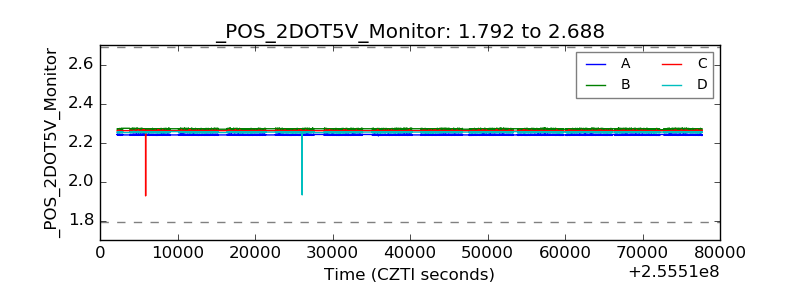 |
| +5 Volts monitor |  |
| _ROLL_ROT |  |
| _Roll_DEC | 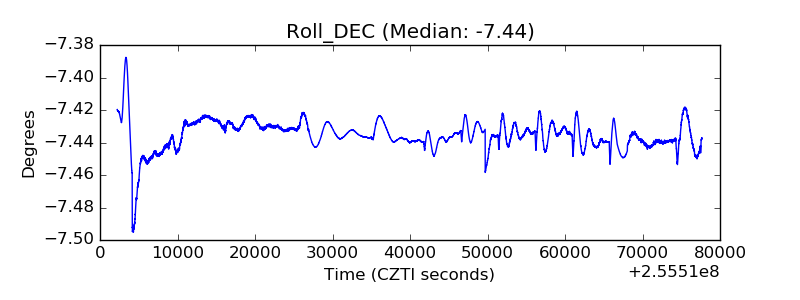 |
| _Roll_RA |  |
| Veto Counter | 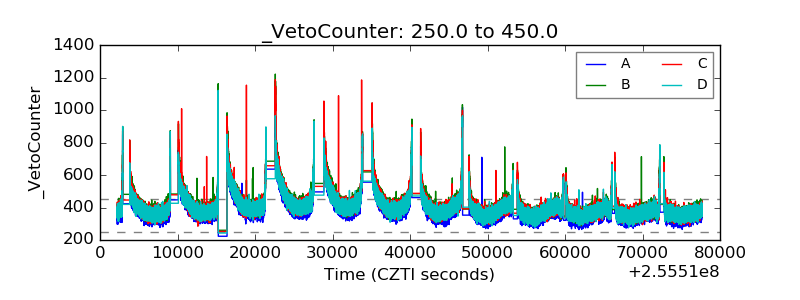 |