| Param | Original file | Final file |
|---|---|---|
| Filename | modeM0/AS1G08_021T01_9000001880cztM0_level2_bc.evt | modeM0/AS1G08_021T01_9000001880cztM0_level2_quad_clean.evt |
| Size (bytes) | 2,917,912,320 | 1,009,134,720 |
| Size | 2.7 GB | 962.4 MB |
| Events in quadrant A | 16,399,002 | 6,567,491 |
| Events in quadrant B | 24,256,362 | 6,339,251 |
| Events in quadrant C | 13,811,933 | 6,519,744 |
| Events in quadrant D | 28,984,109 | 6,188,635 |
| Mode M0 | |||
|---|---|---|---|
| Quadrant | BADHDUFLAG | Total packets | Discarded packets |
| A | 0 | 155672 | 0 |
| B | 0 | 190213 | 0 |
| C | 0 | 146857 | 0 |
| D | 0 | 195505 | 0 |
| Mode M9 | |||
|---|---|---|---|
| Quadrant | BADHDUFLAG | Total packets | Discarded packets |
| A | 0 | 92 | 0 |
| B | 0 | 92 | 0 |
| C | 0 | 92 | 0 |
| D | 0 | 92 | 0 |
| Mode SS | |||
|---|---|---|---|
| Quadrant | BADHDUFLAG | Total packets | Discarded packets |
| A | 0 | 1466 | 0 |
| B | 0 | 1466 | 0 |
| C | 0 | 1466 | 0 |
| D | 0 | 1466 | 0 |
| Quadrant | Total seconds | Saturated seconds | Saturation percentage |
|---|---|---|---|
| A | 72185 | 1151 | 1.594514% |
| B | 72185 | 5713 | 7.914387% |
| C | 72185 | 550 | 0.761931% |
| D | 72185 | 3360 | 4.654707% |
Noise dominated data is calculated using 1-second bins in cleaned event files. If a bin has >2000 counts, and if more than 50% of those come from <1% of pixels, then it is considered to be noise-dominated and hence unusable.
| Quadrant | # 1 sec bins | Bins with >0 counts | Bins with >2000 counts | High rate bins dominated by noise | Noise dominated (total time) | Noise dominated (detector-on time) | Marked lightcurve |
|---|---|---|---|---|---|---|---|
| A | 115065 | 72189 | 6 | 6 | 0.01% | 0.01% | 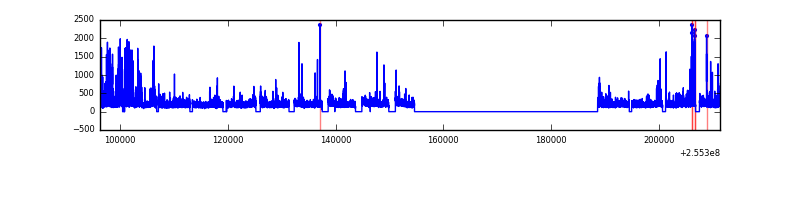 |
| B | 115065 | 72178 | 328 | 328 | 0.29% | 0.45% | 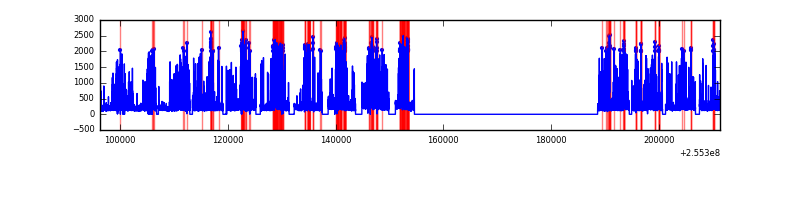 |
| C | 115065 | 72188 | 0 | 0 | 0.00% | 0.00% | 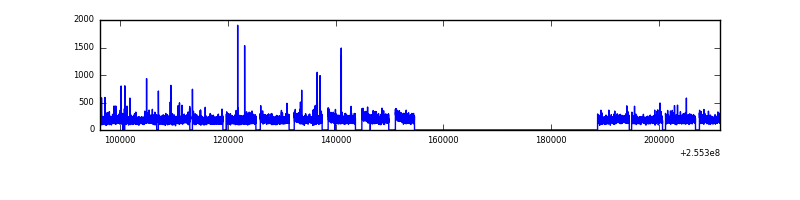 |
| D | 115065 | 72185 | 672 | 672 | 0.58% | 0.93% |  |
Top three noisy pixels from each quadrant. If the there are fewer than three noisy pixels in the level2.evt file, extra rows are filled as -1
| Pixel properties | Quadrant properties | ||||||
|---|---|---|---|---|---|---|---|
| Quadrant | DetID | PixID | Counts | Sigma | Mean | Median | Sigma |
| A | 15 | 239 | 1706717 | 2180.27 | 3568 | 3501 | 781.2 |
| A | 12 | 189 | 386461 | 490.22 | 3568 | 3501 | 781.2 |
| A | 8 | 15 | 245731 | 310.08 | 3568 | 3501 | 781.2 |
| B | 4 | 239 | 9309330 | 14254.05 | 3473 | 3385 | 652.9 |
| B | 0 | 214 | 318446 | 482.58 | 3473 | 3385 | 652.9 |
| B | 3 | 209 | 194536 | 292.79 | 3473 | 3385 | 652.9 |
| C | 15 | 208 | 57534 | 69.96 | 3497 | 3453 | 773.0 |
| C | 8 | 128 | 21839 | 23.79 | 3497 | 3453 | 773.0 |
| C | 13 | 61 | 21033 | 22.74 | 3497 | 3453 | 773.0 |
| D | 1 | 52 | 12911045 | 16160.91 | 3423 | 3329 | 798.7 |
| D | 10 | 199 | 1165250 | 1454.77 | 3423 | 3329 | 798.7 |
| D | 2 | 136 | 659194 | 821.17 | 3423 | 3329 | 798.7 |
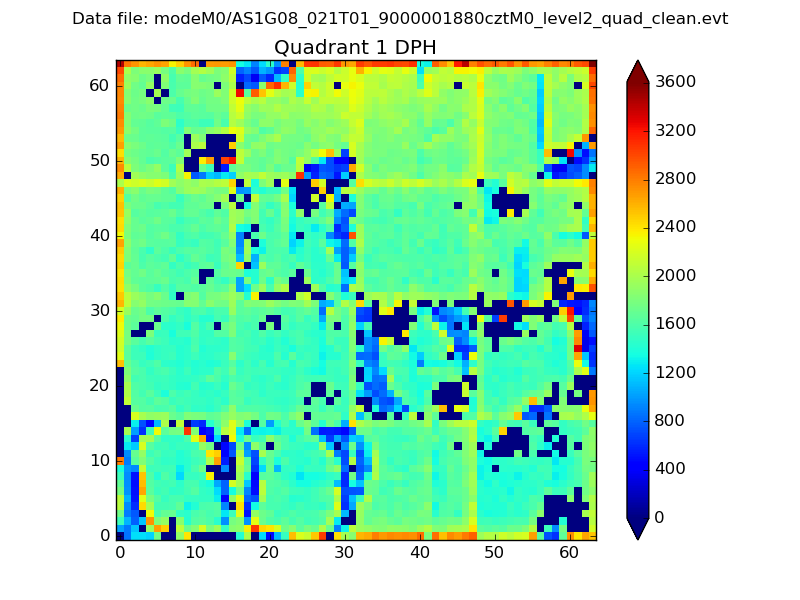
Histogram calculated using DETX and DETY for each event in the final _common_clean file
| Quadrant A | 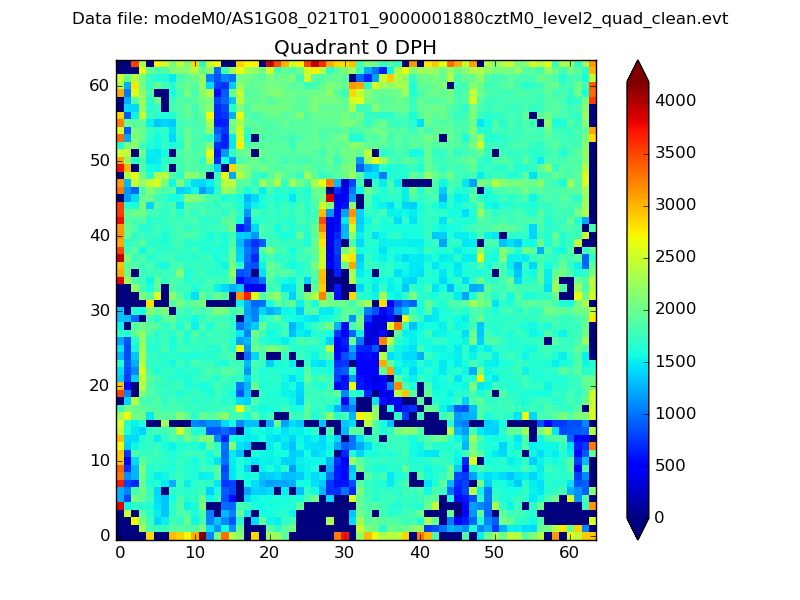 |
 |
Quadrant B |
|---|---|---|---|
| Quadrant D |  |
 |
Quadrant C |
| Plot type | Count rate plots | Images |
|---|---|---|
| Comparison with Poisson distribution Blue bars denote a histogram of data divided into 1 sec bins. Red curve is a Poisson curve with rate = median count rate of data. |
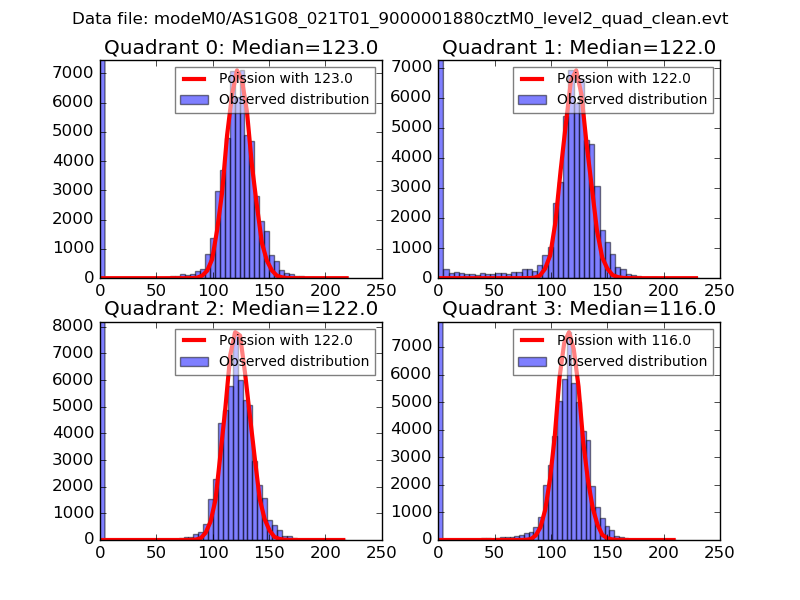 |
 |
| Quadrant-wise count rates Data is divided into 100 sec bins |
 |
|
| Module-wise count rates for Quadrant A Data is divided into 100 sec bins |
 |
 |
| Module-wise count rates for Quadrant B Data is divided into 100 sec bins |
 |
 |
| Module-wise count rates for Quadrant C Data is divided into 100 sec bins |
 |
 |
| Module-wise count rates for Quadrant D Data is divided into 100 sec bins |
 |
 |
| Parameter | Plot |
|---|---|
| CZT HV Monitor |  |
| D_VDD |  |
| Temperature 1 |  |
| Veto HV Monitor |  |
| Veto LLD |  |
| Alpha Counter |  |
| _CPM_Rate |  |
| CZT Counter | 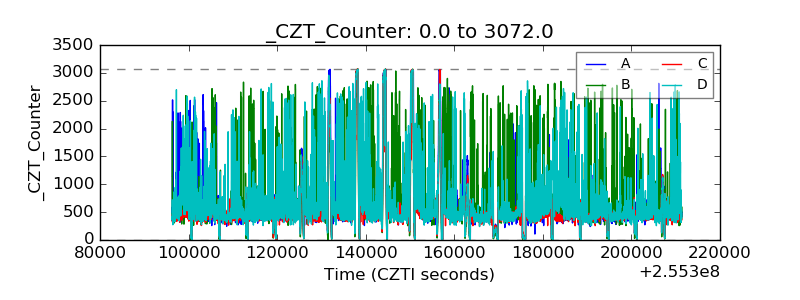 |
| +2.5 Volts monitor |  |
| +5 Volts monitor |  |
| _ROLL_ROT |  |
| _Roll_DEC |  |
| _Roll_RA | 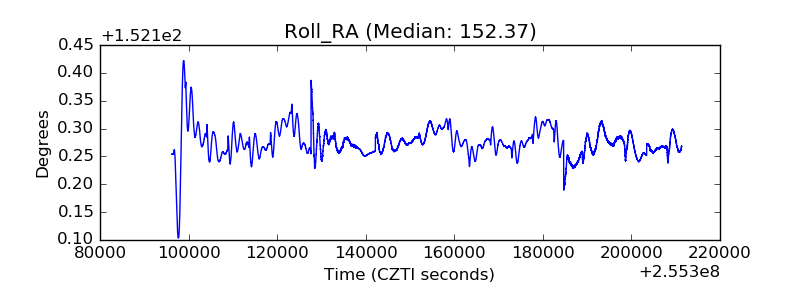 |
| Veto Counter |  |