| Param | Original file | Final file |
|---|---|---|
| Filename | modeM0/AS1A04_130T04_9000001872cztM0_level2_bc.evt | modeM0/AS1A04_130T04_9000001872cztM0_level2_quad_clean.evt |
| Size (bytes) | 945,434,880 | 345,905,280 |
| Size | 901.6 MB | 329.9 MB |
| Events in quadrant A | 5,588,476 | 2,138,541 |
| Events in quadrant B | 7,758,357 | 2,176,462 |
| Events in quadrant C | 5,678,822 | 2,156,678 |
| Events in quadrant D | 7,666,346 | 2,054,260 |
| Mode M0 | |||
|---|---|---|---|
| Quadrant | BADHDUFLAG | Total packets | Discarded packets |
| A | 0 | 58905 | 0 |
| B | 0 | 66947 | 0 |
| C | 0 | 59278 | 0 |
| D | 0 | 66168 | 0 |
| Mode M9 | |||
|---|---|---|---|
| Quadrant | BADHDUFLAG | Total packets | Discarded packets |
| A | 0 | 31 | 0 |
| B | 0 | 31 | 0 |
| C | 0 | 31 | 0 |
| D | 0 | 31 | 0 |
| Mode SS | |||
|---|---|---|---|
| Quadrant | BADHDUFLAG | Total packets | Discarded packets |
| A | 0 | 570 | 0 |
| B | 0 | 584 | 0 |
| C | 0 | 572 | 0 |
| D | 0 | 572 | 0 |
| Quadrant | Total seconds | Saturated seconds | Saturation percentage |
|---|---|---|---|
| A | 28403 | 668 | 2.351864% |
| B | 28327 | 1179 | 4.162107% |
| C | 28364 | 460 | 1.621774% |
| D | 28385 | 991 | 3.491281% |
Noise dominated data is calculated using 1-second bins in cleaned event files. If a bin has >2000 counts, and if more than 50% of those come from <1% of pixels, then it is considered to be noise-dominated and hence unusable.
| Quadrant | # 1 sec bins | Bins with >0 counts | Bins with >2000 counts | High rate bins dominated by noise | Noise dominated (total time) | Noise dominated (detector-on time) | Marked lightcurve |
|---|---|---|---|---|---|---|---|
| A | 33515 | 28899 | 0 | 0 | 0.00% | 0.00% |  |
| B | 33515 | 28810 | 44 | 44 | 0.13% | 0.15% |  |
| C | 33515 | 28858 | 2 | 2 | 0.01% | 0.01% |  |
| D | 33515 | 28891 | 61 | 61 | 0.18% | 0.21% | 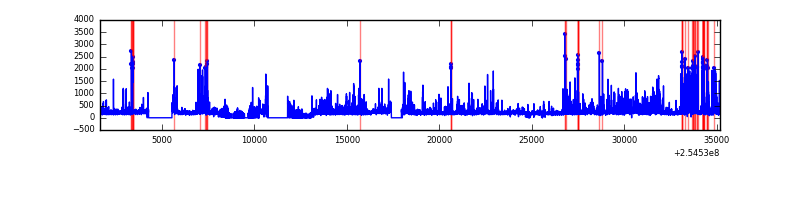 |
Top three noisy pixels from each quadrant. If the there are fewer than three noisy pixels in the level2.evt file, extra rows are filled as -1
| Pixel properties | Quadrant properties | ||||||
|---|---|---|---|---|---|---|---|
| Quadrant | DetID | PixID | Counts | Sigma | Mean | Median | Sigma |
| A | 12 | 189 | 93006 | 292.48 | 1411 | 1378 | 313.3 |
| A | 12 | 96 | 50003 | 155.21 | 1411 | 1378 | 313.3 |
| A | 12 | 194 | 9853 | 27.05 | 1411 | 1378 | 313.3 |
| B | 4 | 239 | 1014599 | 3741.64 | 1421 | 1381 | 270.8 |
| B | 3 | 64 | 783574 | 2888.5 | 1421 | 1381 | 270.8 |
| B | 11 | 51 | 228675 | 839.36 | 1421 | 1381 | 270.8 |
| C | 15 | 208 | 191179 | 619.42 | 1392 | 1369 | 306.4 |
| C | 8 | 128 | 10287 | 29.1 | 1392 | 1369 | 306.4 |
| C | 8 | 222 | 9964 | 28.05 | 1392 | 1369 | 306.4 |
| D | 1 | 52 | 926790 | 2851.2 | 1384 | 1330 | 324.6 |
| D | 10 | 157 | 816618 | 2511.77 | 1384 | 1330 | 324.6 |
| D | 13 | 249 | 406066 | 1246.93 | 1384 | 1330 | 324.6 |
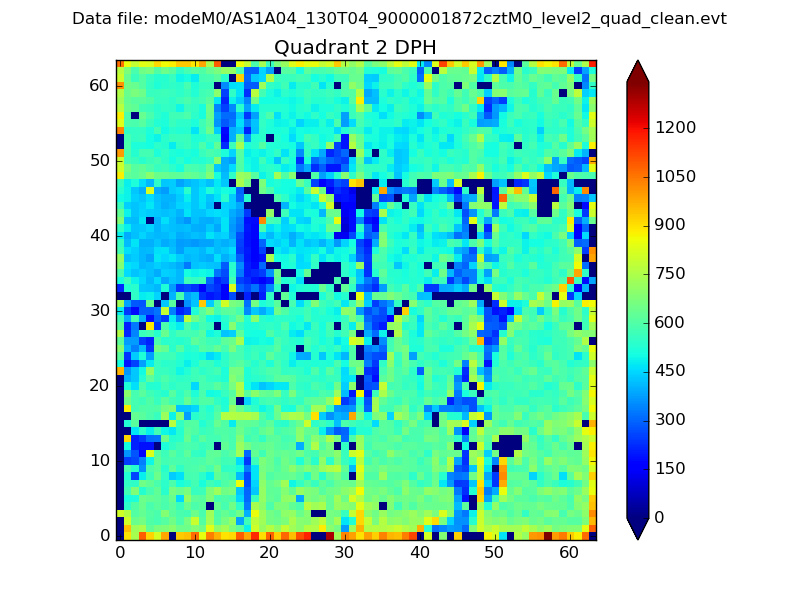
Histogram calculated using DETX and DETY for each event in the final _common_clean file
| Quadrant A |  |
 |
Quadrant B |
|---|---|---|---|
| Quadrant D |  |
 |
Quadrant C |
| Plot type | Count rate plots | Images |
|---|---|---|
| Comparison with Poisson distribution Blue bars denote a histogram of data divided into 1 sec bins. Red curve is a Poisson curve with rate = median count rate of data. |
 |
 |
| Quadrant-wise count rates Data is divided into 100 sec bins |
 |
|
| Module-wise count rates for Quadrant A Data is divided into 100 sec bins |
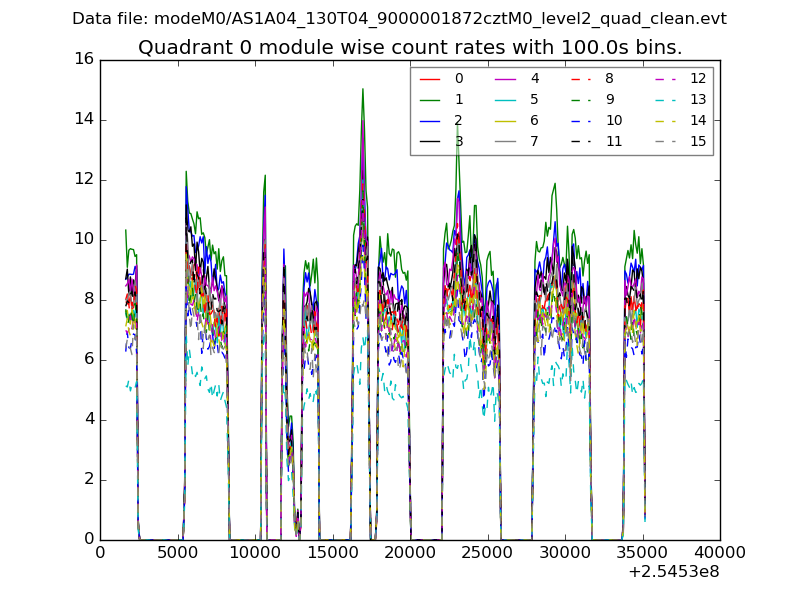 |
 |
| Module-wise count rates for Quadrant B Data is divided into 100 sec bins |
 |
 |
| Module-wise count rates for Quadrant C Data is divided into 100 sec bins |
 |
 |
| Module-wise count rates for Quadrant D Data is divided into 100 sec bins |
 |
 |
| Parameter | Plot |
|---|---|
| CZT HV Monitor | 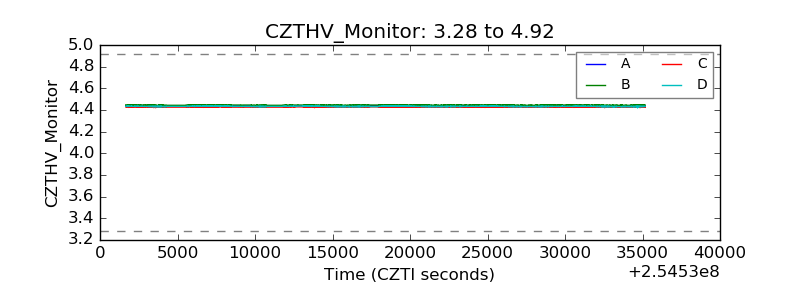 |
| D_VDD |  |
| Temperature 1 |  |
| Veto HV Monitor |  |
| Veto LLD |  |
| Alpha Counter |  |
| _CPM_Rate | 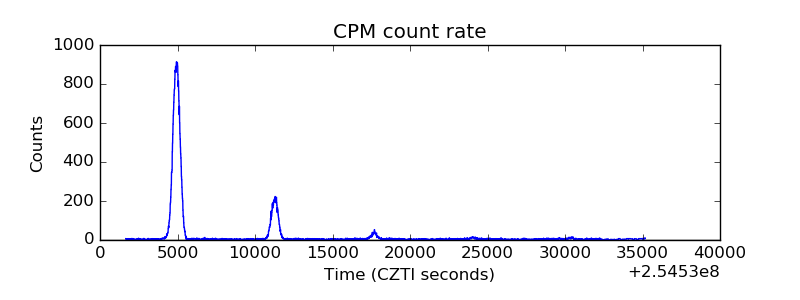 |
| CZT Counter |  |
| +2.5 Volts monitor |  |
| +5 Volts monitor |  |
| _ROLL_ROT |  |
| _Roll_DEC |  |
| _Roll_RA |  |
| Veto Counter |  |