| Param | Original file | Final file |
|---|---|---|
| Filename | modeM0/AS1A02_058T03_9000001870cztM0_level2_bc.evt | modeM0/AS1A02_058T03_9000001870cztM0_level2_quad_clean.evt |
| Size (bytes) | 460,483,200 | 164,580,480 |
| Size | 439.2 MB | 157.0 MB |
| Events in quadrant A | 2,709,344 | 1,050,894 |
| Events in quadrant B | 3,472,347 | 1,062,851 |
| Events in quadrant C | 2,691,902 | 1,062,806 |
| Events in quadrant D | 4,222,514 | 952,788 |
| Mode SS | |||
|---|---|---|---|
| Quadrant | BADHDUFLAG | Total packets | Discarded packets |
| A | 0 | 252 | 0 |
| B | 0 | 252 | 0 |
| C | 0 | 252 | 0 |
| D | 0 | 252 | 0 |
| Mode M0 | |||
|---|---|---|---|
| Quadrant | BADHDUFLAG | Total packets | Discarded packets |
| A | 0 | 25805 | 0 |
| B | 0 | 29348 | 0 |
| C | 0 | 25595 | 0 |
| D | 0 | 31134 | 0 |
| Mode M9 | |||
|---|---|---|---|
| Quadrant | BADHDUFLAG | Total packets | Discarded packets |
| A | 0 | 40 | 0 |
| B | 0 | 40 | 0 |
| C | 0 | 40 | 0 |
| D | 0 | 40 | 0 |
| Quadrant | Total seconds | Saturated seconds | Saturation percentage |
|---|---|---|---|
| A | 12374 | 69 | 0.557621% |
| B | 12374 | 379 | 3.062874% |
| C | 12374 | 34 | 0.274770% |
| D | 12374 | 541 | 4.372070% |
Noise dominated data is calculated using 1-second bins in cleaned event files. If a bin has >2000 counts, and if more than 50% of those come from <1% of pixels, then it is considered to be noise-dominated and hence unusable.
| Quadrant | # 1 sec bins | Bins with >0 counts | Bins with >2000 counts | High rate bins dominated by noise | Noise dominated (total time) | Noise dominated (detector-on time) | Marked lightcurve |
|---|---|---|---|---|---|---|---|
| A | 16385 | 12375 | 0 | 0 | 0.00% | 0.00% |  |
| B | 16385 | 12374 | 3 | 3 | 0.02% | 0.02% |  |
| C | 16385 | 12374 | 0 | 0 | 0.00% | 0.00% |  |
| D | 16384 | 12374 | 269 | 269 | 1.64% | 2.17% |  |
Top three noisy pixels from each quadrant. If the there are fewer than three noisy pixels in the level2.evt file, extra rows are filled as -1
| Pixel properties | Quadrant properties | ||||||
|---|---|---|---|---|---|---|---|
| Quadrant | DetID | PixID | Counts | Sigma | Mean | Median | Sigma |
| A | 12 | 189 | 73215 | 490.18 | 678 | 666 | 148.0 |
| A | 12 | 96 | 21253 | 139.1 | 678 | 666 | 148.0 |
| A | 13 | 248 | 5403 | 32.01 | 678 | 666 | 148.0 |
| B | 4 | 239 | 542965 | 4188.52 | 690 | 675 | 129.5 |
| B | 3 | 64 | 52953 | 403.78 | 690 | 675 | 129.5 |
| B | 0 | 230 | 46863 | 356.75 | 690 | 675 | 129.5 |
| C | 15 | 208 | 43104 | 288.29 | 673 | 665 | 147.2 |
| C | 14 | 234 | 8478 | 53.07 | 673 | 665 | 147.2 |
| C | 8 | 222 | 4498 | 26.04 | 673 | 665 | 147.2 |
| D | 1 | 52 | 1419717 | 9646.28 | 648 | 624 | 147.1 |
| D | 10 | 157 | 94946 | 641.15 | 648 | 624 | 147.1 |
| D | 13 | 104 | 75340 | 507.88 | 648 | 624 | 147.1 |
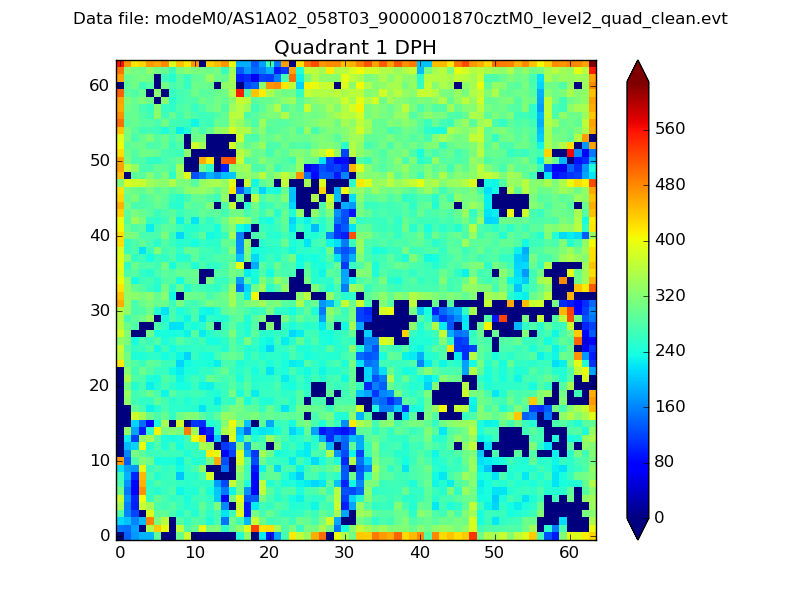
Histogram calculated using DETX and DETY for each event in the final _common_clean file
| Quadrant A |  |
 |
Quadrant B |
|---|---|---|---|
| Quadrant D | 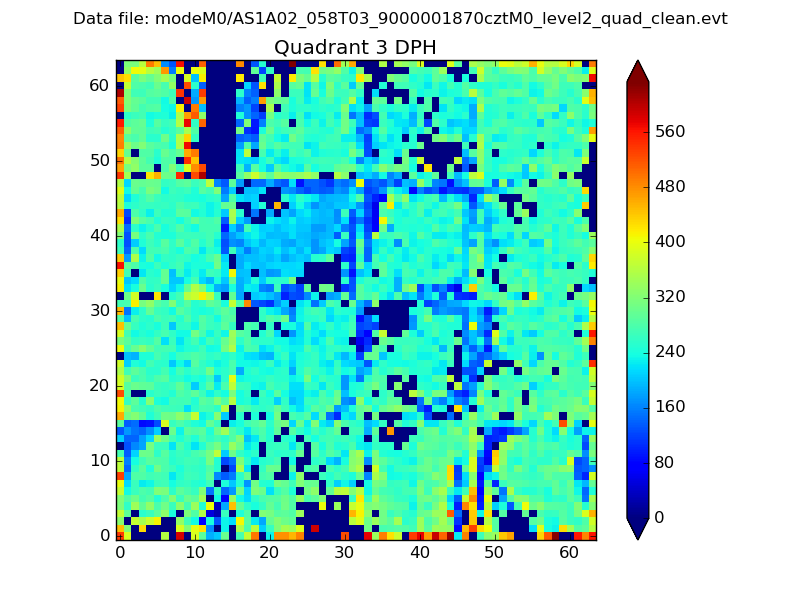 |
 |
Quadrant C |
| Plot type | Count rate plots | Images |
|---|---|---|
| Comparison with Poisson distribution Blue bars denote a histogram of data divided into 1 sec bins. Red curve is a Poisson curve with rate = median count rate of data. |
 |
 |
| Quadrant-wise count rates Data is divided into 100 sec bins |
 |
|
| Module-wise count rates for Quadrant A Data is divided into 100 sec bins |
 |
 |
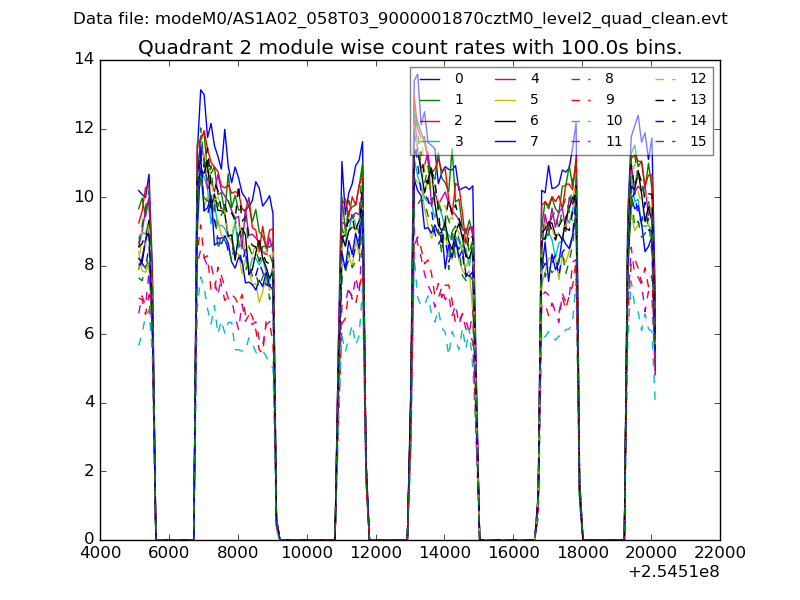
| Module-wise count rates for Quadrant B Data is divided into 100 sec bins |
 |
 |
| Module-wise count rates for Quadrant C Data is divided into 100 sec bins |
 |
 |
| Module-wise count rates for Quadrant D Data is divided into 100 sec bins |
 |
 |
| Parameter | Plot |
|---|---|
| CZT HV Monitor |  |
| D_VDD |  |
| Temperature 1 |  |
| Veto HV Monitor |  |
| Veto LLD |  |
| Alpha Counter |  |
| _CPM_Rate | 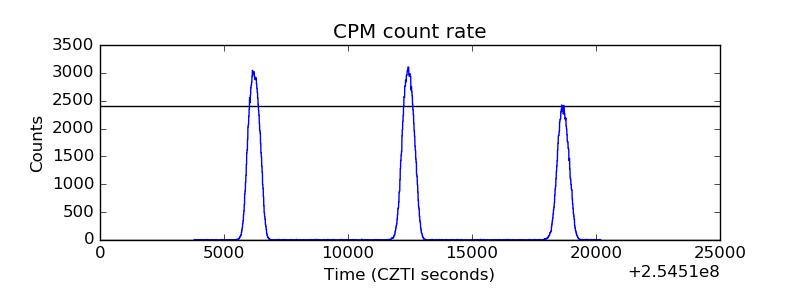 |
| CZT Counter |  |
| +2.5 Volts monitor |  |
| +5 Volts monitor | 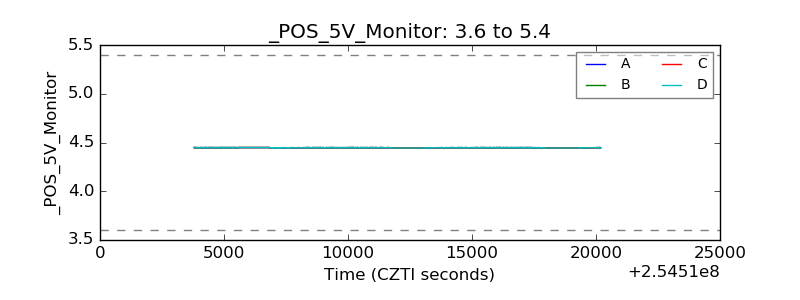 |
| _ROLL_ROT |  |
| _Roll_DEC |  |
| _Roll_RA | 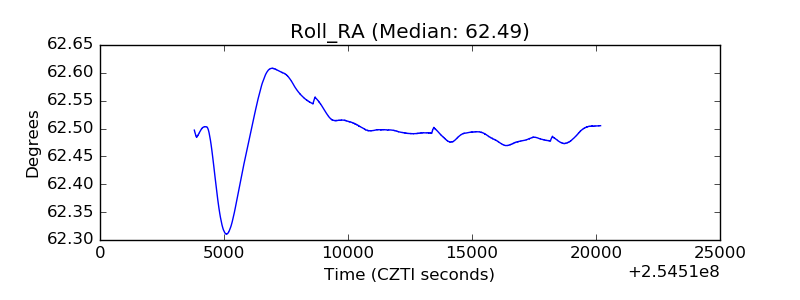 |
| Veto Counter |  |