| Param | Original file | Final file |
|---|---|---|
| Filename | modeM0/AS1T01_218T01_9000001852cztM0_level2_bc.evt | modeM0/AS1T01_218T01_9000001852cztM0_level2_quad_clean.evt |
| Size (bytes) | 2,594,900,160 | 952,859,520 |
| Size | 2.4 GB | 908.7 MB |
| Events in quadrant A | 16,107,646 | 5,997,699 |
| Events in quadrant B | 18,651,220 | 6,112,793 |
| Events in quadrant C | 14,542,862 | 6,021,578 |
| Events in quadrant D | 24,267,324 | 5,681,080 |
| Mode M0 | |||
|---|---|---|---|
| Quadrant | BADHDUFLAG | Total packets | Discarded packets |
| A | 0 | 157884 | 0 |
| B | 0 | 166326 | 0 |
| C | 0 | 151858 | 0 |
| D | 0 | 181387 | 0 |
| Mode SS | |||
|---|---|---|---|
| Quadrant | BADHDUFLAG | Total packets | Discarded packets |
| A | 0 | 1502 | 0 |
| B | 0 | 1502 | 0 |
| C | 0 | 1502 | 0 |
| D | 0 | 1502 | 0 |
| Mode M9 | |||
|---|---|---|---|
| Quadrant | BADHDUFLAG | Total packets | Discarded packets |
| A | 0 | 117 | 0 |
| B | 0 | 117 | 0 |
| C | 0 | 117 | 0 |
| D | 0 | 117 | 0 |
| Quadrant | Total seconds | Saturated seconds | Saturation percentage |
|---|---|---|---|
| A | 73610 | 1091 | 1.482136% |
| B | 73610 | 1978 | 2.687135% |
| C | 73610 | 706 | 0.959109% |
| D | 73610 | 2237 | 3.038989% |
Noise dominated data is calculated using 1-second bins in cleaned event files. If a bin has >2000 counts, and if more than 50% of those come from <1% of pixels, then it is considered to be noise-dominated and hence unusable.
| Quadrant | # 1 sec bins | Bins with >0 counts | Bins with >2000 counts | High rate bins dominated by noise | Noise dominated (total time) | Noise dominated (detector-on time) | Marked lightcurve |
|---|---|---|---|---|---|---|---|
| A | 85506 | 73613 | 0 | 0 | 0.00% | 0.00% |  |
| B | 85506 | 73609 | 50 | 50 | 0.06% | 0.07% |  |
| C | 85506 | 73612 | 6 | 6 | 0.01% | 0.01% |  |
| D | 85506 | 73610 | 456 | 456 | 0.53% | 0.62% |  |
Top three noisy pixels from each quadrant. If the there are fewer than three noisy pixels in the level2.evt file, extra rows are filled as -1
| Pixel properties | Quadrant properties | ||||||
|---|---|---|---|---|---|---|---|
| Quadrant | DetID | PixID | Counts | Sigma | Mean | Median | Sigma |
| A | 12 | 189 | 1098914 | 1344.96 | 3735 | 3658 | 814.3 |
| A | 1 | 162 | 350744 | 426.22 | 3735 | 3658 | 814.3 |
| A | 8 | 6 | 81433 | 95.51 | 3735 | 3658 | 814.3 |
| B | 4 | 239 | 2716980 | 3819.46 | 3777 | 3674 | 710.4 |
| B | 0 | 214 | 274832 | 381.7 | 3777 | 3674 | 710.4 |
| B | 3 | 64 | 267292 | 371.09 | 3777 | 3674 | 710.4 |
| C | 14 | 234 | 135995 | 165.15 | 3668 | 3616 | 801.6 |
| C | 13 | 61 | 21997 | 22.93 | 3668 | 3616 | 801.6 |
| C | 12 | 4 | 16218 | 15.72 | 3668 | 3616 | 801.6 |
| D | 1 | 52 | 6307232 | 7459.85 | 3638 | 3502 | 845.0 |
| D | 1 | 255 | 1820108 | 2149.78 | 3638 | 3502 | 845.0 |
| D | 8 | 195 | 480017 | 563.91 | 3638 | 3502 | 845.0 |
Histogram calculated using DETX and DETY for each event in the final _common_clean file
| Quadrant A | 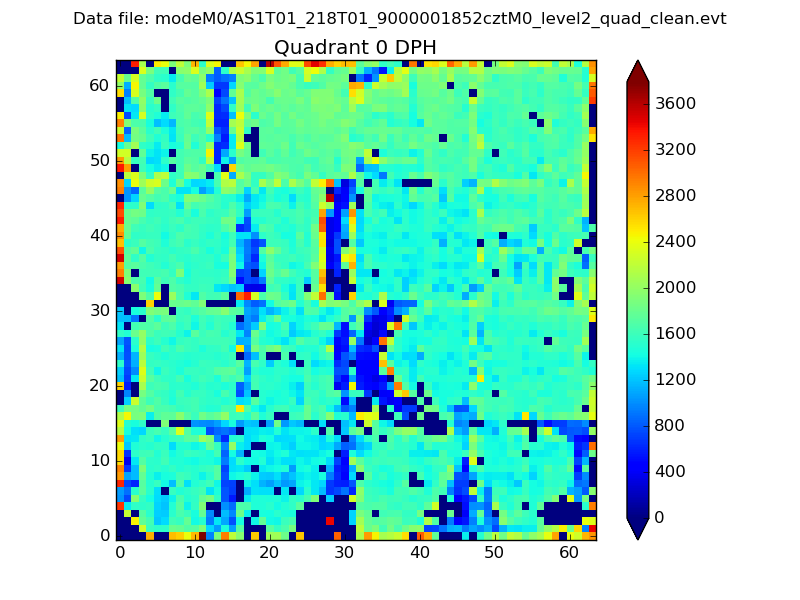 |
 |
Quadrant B |
|---|---|---|---|
| Quadrant D |  |
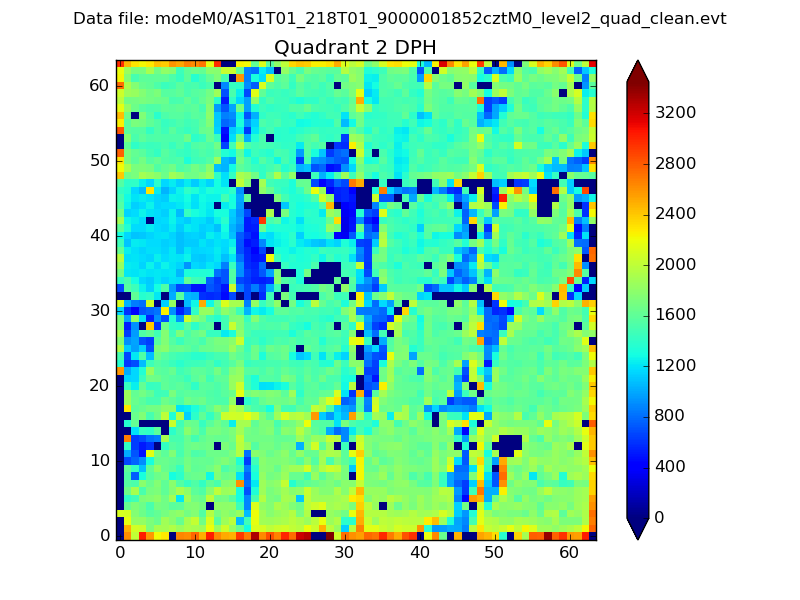 |
Quadrant C |
| Plot type | Count rate plots | Images |
|---|---|---|
| Comparison with Poisson distribution Blue bars denote a histogram of data divided into 1 sec bins. Red curve is a Poisson curve with rate = median count rate of data. |
 |
 |
| Quadrant-wise count rates Data is divided into 100 sec bins |
 |
|
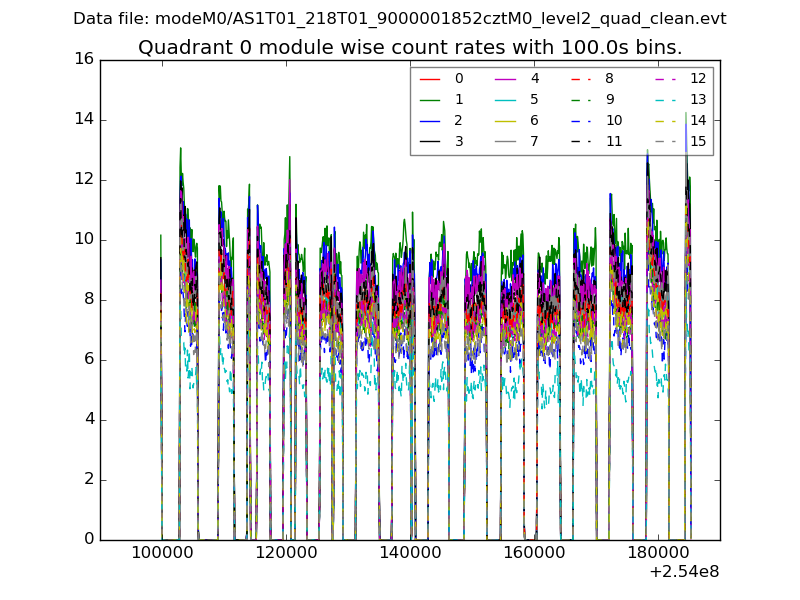
| Module-wise count rates for Quadrant A Data is divided into 100 sec bins |
 |
 |
| Module-wise count rates for Quadrant B Data is divided into 100 sec bins |
 |
 |
| Module-wise count rates for Quadrant C Data is divided into 100 sec bins |
 |
 |
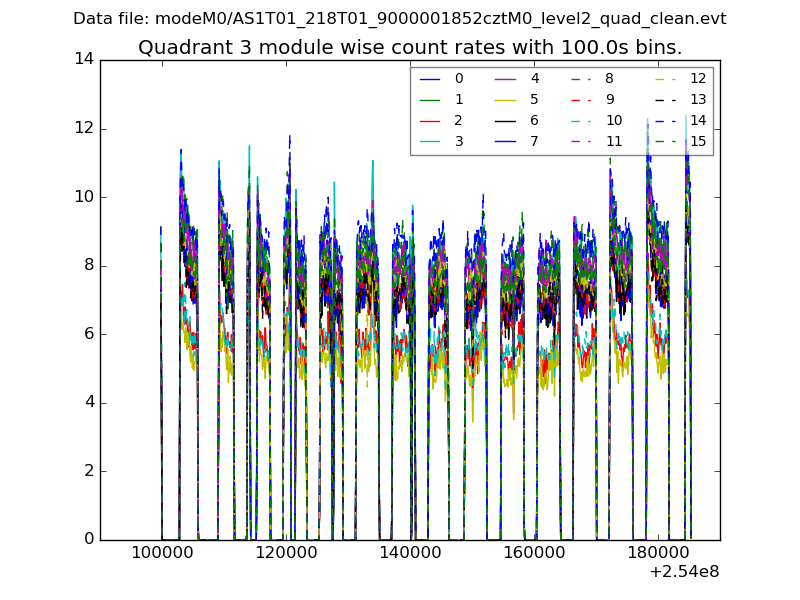
| Module-wise count rates for Quadrant D Data is divided into 100 sec bins |
 |
 |
| Parameter | Plot |
|---|---|
| CZT HV Monitor |  |
| D_VDD |  |
| Temperature 1 |  |
| Veto HV Monitor |  |
| Veto LLD |  |
| Alpha Counter |  |
| _CPM_Rate |  |
| CZT Counter | 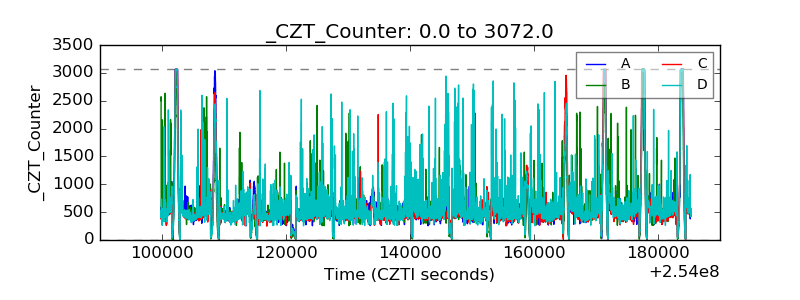 |
| +2.5 Volts monitor |  |
| +5 Volts monitor | 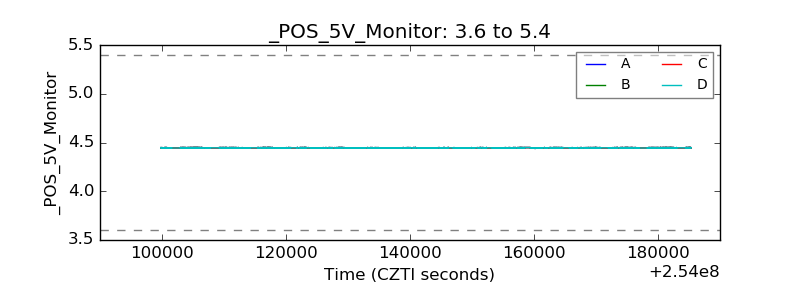 |
| _ROLL_ROT |  |
| _Roll_DEC |  |
| _Roll_RA |  |
| Veto Counter |  |