| Param | Original file | Final file |
|---|---|---|
| Filename | modeM0/AS1A04_085T02_9000001846cztM0_level2_bc.evt | modeM0/AS1A04_085T02_9000001846cztM0_level2_quad_clean.evt |
| Size (bytes) | 635,817,600 | 189,472,320 |
| Size | 606.4 MB | 180.7 MB |
| Events in quadrant A | 5,102,328 | 1,169,393 |
| Events in quadrant B | 4,222,770 | 1,179,637 |
| Events in quadrant C | 3,403,846 | 1,162,739 |
| Events in quadrant D | 5,422,788 | 1,115,022 |
| Mode M9 | |||
|---|---|---|---|
| Quadrant | BADHDUFLAG | Total packets | Discarded packets |
| A | 0 | 13 | 0 |
| B | 0 | 13 | 0 |
| C | 0 | 13 | 0 |
| D | 0 | 13 | 0 |
| Mode M0 | |||
|---|---|---|---|
| Quadrant | BADHDUFLAG | Total packets | Discarded packets |
| A | 0 | 41466 | 0 |
| B | 0 | 37478 | 0 |
| C | 0 | 34284 | 0 |
| D | 0 | 41316 | 0 |
| Mode SS | |||
|---|---|---|---|
| Quadrant | BADHDUFLAG | Total packets | Discarded packets |
| A | 0 | 332 | 0 |
| B | 0 | 332 | 0 |
| C | 0 | 332 | 0 |
| D | 0 | 332 | 0 |
| Quadrant | Total seconds | Saturated seconds | Saturation percentage |
|---|---|---|---|
| A | 16093 | 611 | 3.796682% |
| B | 16093 | 671 | 4.169515% |
| C | 16093 | 326 | 2.025725% |
| D | 16093 | 775 | 4.815758% |
Noise dominated data is calculated using 1-second bins in cleaned event files. If a bin has >2000 counts, and if more than 50% of those come from <1% of pixels, then it is considered to be noise-dominated and hence unusable.
| Quadrant | # 1 sec bins | Bins with >0 counts | Bins with >2000 counts | High rate bins dominated by noise | Noise dominated (total time) | Noise dominated (detector-on time) | Marked lightcurve |
|---|---|---|---|---|---|---|---|
| A | 17599 | 16091 | 3 | 3 | 0.02% | 0.02% |  |
| B | 17599 | 16093 | 2 | 2 | 0.01% | 0.01% |  |
| C | 17599 | 16091 | 9 | 9 | 0.05% | 0.06% |  |
| D | 17599 | 16094 | 98 | 98 | 0.56% | 0.61% |  |
Top three noisy pixels from each quadrant. If the there are fewer than three noisy pixels in the level2.evt file, extra rows are filled as -1
| Pixel properties | Quadrant properties | ||||||
|---|---|---|---|---|---|---|---|
| Quadrant | DetID | PixID | Counts | Sigma | Mean | Median | Sigma |
| A | 13 | 251 | 1508758 | 8433.75 | 789 | 771 | 178.8 |
| A | 12 | 189 | 189073 | 1053.12 | 789 | 771 | 178.8 |
| A | 1 | 162 | 131057 | 728.65 | 789 | 771 | 178.8 |
| B | 4 | 239 | 600905 | 3836.77 | 791 | 768 | 156.4 |
| B | 3 | 64 | 221105 | 1408.65 | 791 | 768 | 156.4 |
| B | 0 | 190 | 85035 | 538.73 | 791 | 768 | 156.4 |
| C | 15 | 208 | 348000 | 1996.33 | 775 | 760 | 173.9 |
| C | 8 | 128 | 9925 | 52.69 | 775 | 760 | 173.9 |
| C | 8 | 112 | 5860 | 29.32 | 775 | 760 | 173.9 |
| D | 1 | 52 | 1494595 | 8108.99 | 775 | 743 | 184.2 |
| D | 13 | 104 | 414719 | 2247.16 | 775 | 743 | 184.2 |
| D | 2 | 14 | 135128 | 729.47 | 775 | 743 | 184.2 |
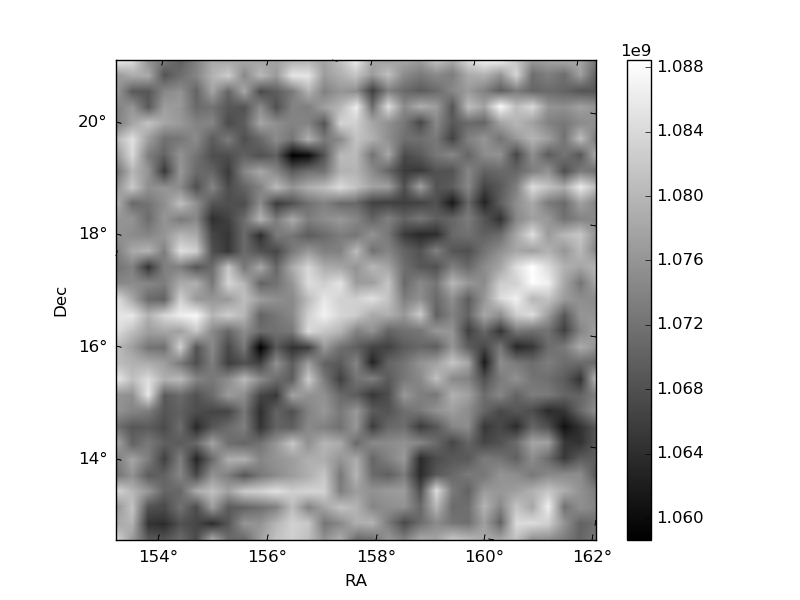
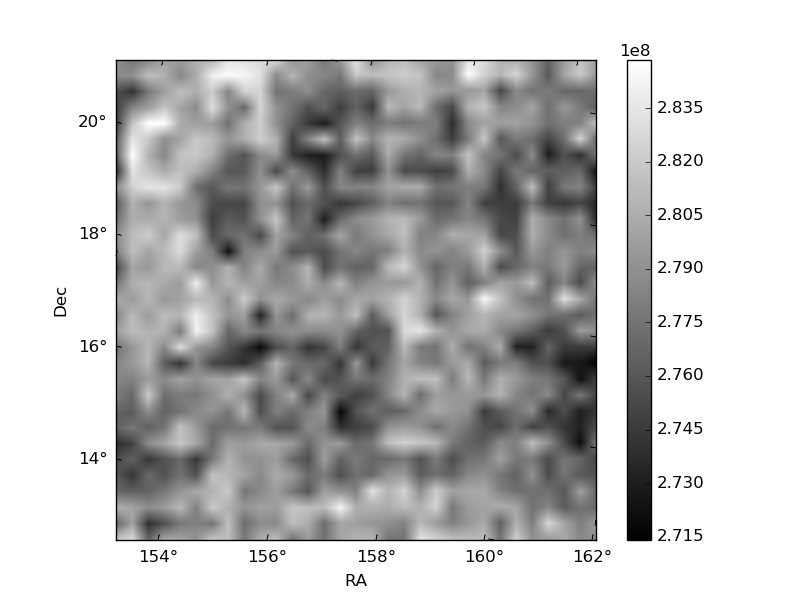
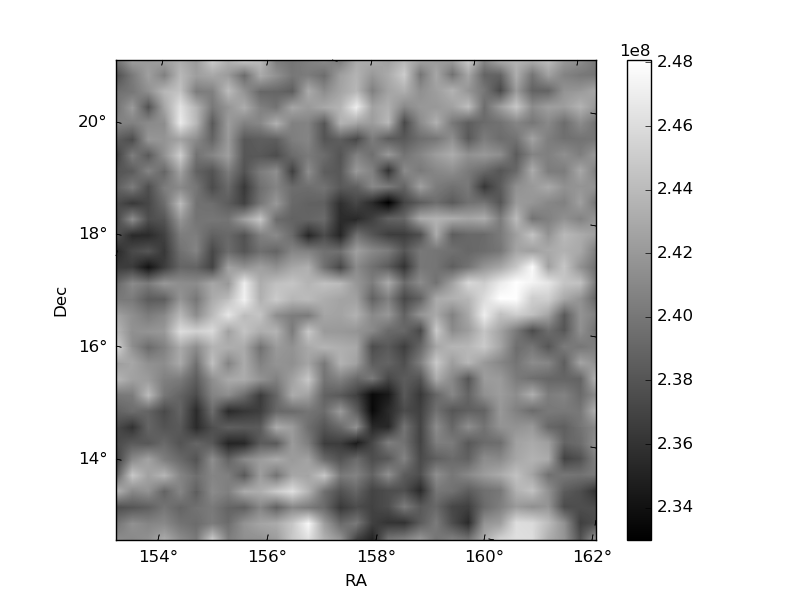
Histogram calculated using DETX and DETY for each event in the final _common_clean file
| Quadrant A |  |
 |
Quadrant B |
|---|---|---|---|
| Quadrant D |  |
 |
Quadrant C |
| Plot type | Count rate plots | Images |
|---|---|---|
| Comparison with Poisson distribution Blue bars denote a histogram of data divided into 1 sec bins. Red curve is a Poisson curve with rate = median count rate of data. |
 |
 |
| Quadrant-wise count rates Data is divided into 100 sec bins |
 |
|
| Module-wise count rates for Quadrant A Data is divided into 100 sec bins |
 |
 |
| Module-wise count rates for Quadrant B Data is divided into 100 sec bins |
 |
 |
| Module-wise count rates for Quadrant C Data is divided into 100 sec bins |
 |
 |
| Module-wise count rates for Quadrant D Data is divided into 100 sec bins |
 |
 |
| Parameter | Plot |
|---|---|
| CZT HV Monitor | 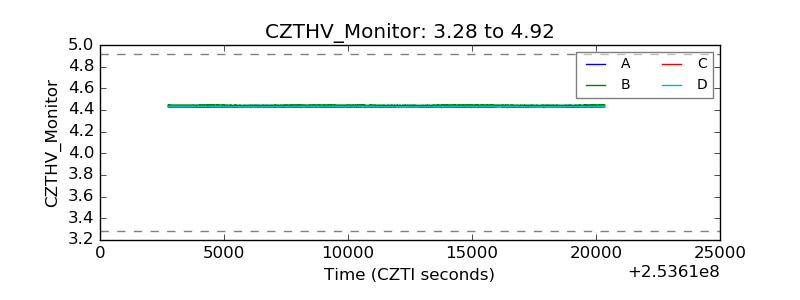 |
| D_VDD |  |
| Temperature 1 |  |
| Veto HV Monitor | 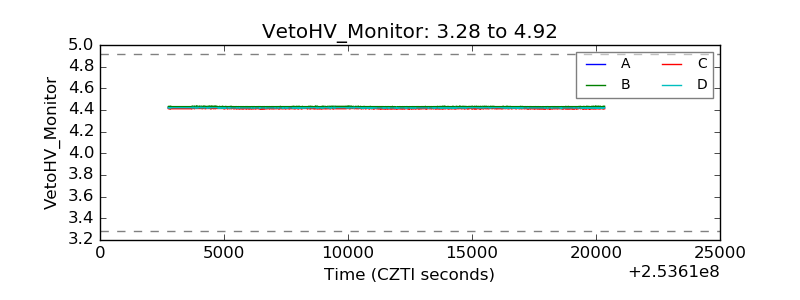 |
| Veto LLD |  |
| Alpha Counter | 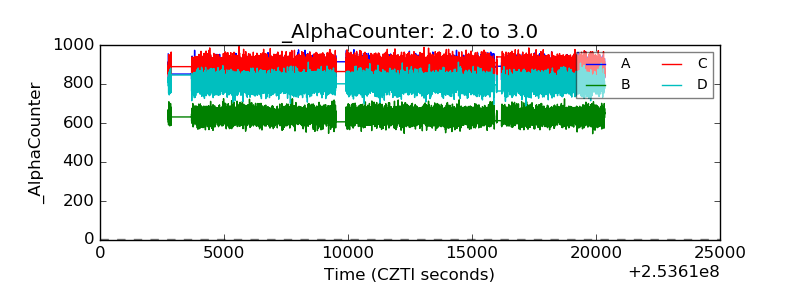 |
| _CPM_Rate | 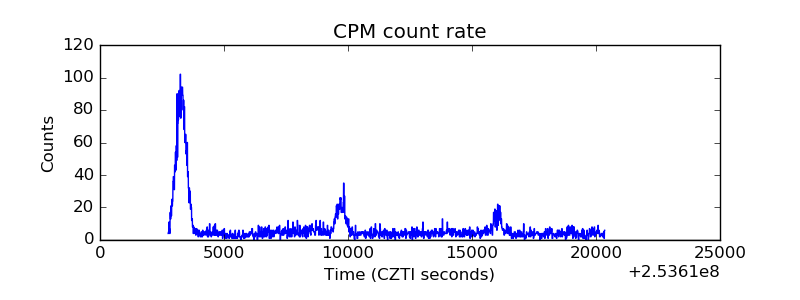 |
| CZT Counter |  |
| +2.5 Volts monitor | 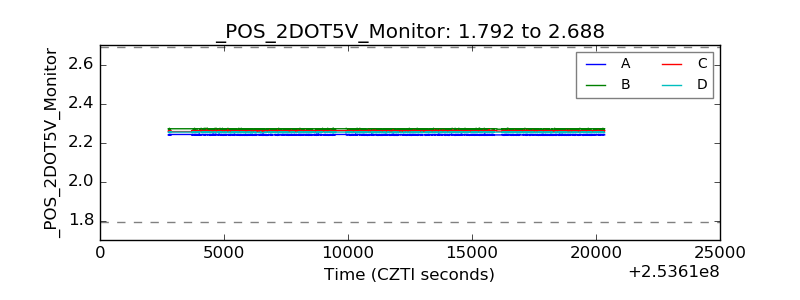 |
| +5 Volts monitor | 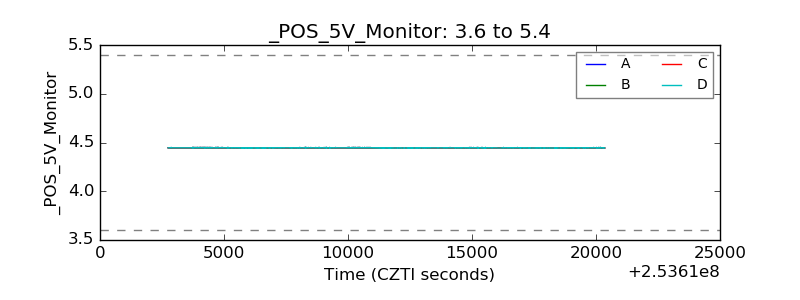 |
| _ROLL_ROT |  |
| _Roll_DEC |  |
| _Roll_RA |  |
| Veto Counter |  |