| Param | Original file | Final file |
|---|---|---|
| Filename | modeM0/AS1A04_104T02_9000001838cztM0_level2_bc.evt | modeM0/AS1A04_104T02_9000001838cztM0_level2_quad_clean.evt |
| Size (bytes) | 3,928,201,920 | 1,330,738,560 |
| Size | 3.7 GB | 1.2 GB |
| Events in quadrant A | 22,583,388 | 9,113,096 |
| Events in quadrant B | 44,823,722 | 8,527,696 |
| Events in quadrant C | 14,523,078 | 9,130,579 |
| Events in quadrant D | 31,987,258 | 8,444,397 |
| Mode M9 | |||
|---|---|---|---|
| Quadrant | BADHDUFLAG | Total packets | Discarded packets |
| A | 0 | 113 | 0 |
| B | 0 | 113 | 0 |
| C | 0 | 113 | 0 |
| D | 0 | 113 | 0 |
| Mode M0 | |||
|---|---|---|---|
| Quadrant | BADHDUFLAG | Total packets | Discarded packets |
| A | 0 | 193701 | 0 |
| B | 0 | 254790 | 0 |
| C | 0 | 151369 | 0 |
| D | 0 | 213514 | 0 |
| Mode SS | |||
|---|---|---|---|
| Quadrant | BADHDUFLAG | Total packets | Discarded packets |
| A | 0 | 1510 | 0 |
| B | 0 | 1510 | 0 |
| C | 0 | 1510 | 0 |
| D | 0 | 1510 | 0 |
| Quadrant | Total seconds | Saturated seconds | Saturation percentage |
|---|---|---|---|
| A | 74214 | 2327 | 3.135527% |
| B | 74178 | 13625 | 18.367980% |
| C | 74214 | 342 | 0.460829% |
| D | 74214 | 5350 | 7.208882% |
Noise dominated data is calculated using 1-second bins in cleaned event files. If a bin has >2000 counts, and if more than 50% of those come from <1% of pixels, then it is considered to be noise-dominated and hence unusable.
| Quadrant | # 1 sec bins | Bins with >0 counts | Bins with >2000 counts | High rate bins dominated by noise | Noise dominated (total time) | Noise dominated (detector-on time) | Marked lightcurve |
|---|---|---|---|---|---|---|---|
| A | 86055 | 74210 | 20 | 20 | 0.02% | 0.03% |  |
| B | 86055 | 74160 | 5960 | 5960 | 6.93% | 8.04% |  |
| C | 86055 | 74208 | 3 | 3 | 0.00% | 0.00% |  |
| D | 86055 | 74206 | 1279 | 1279 | 1.49% | 1.72% |  |
Top three noisy pixels from each quadrant. If the there are fewer than three noisy pixels in the level2.evt file, extra rows are filled as -1
| Pixel properties | Quadrant properties | ||||||
|---|---|---|---|---|---|---|---|
| Quadrant | DetID | PixID | Counts | Sigma | Mean | Median | Sigma |
| A | 13 | 251 | 4495226 | 5602.31 | 3671 | 3612 | 801.7 |
| A | 1 | 162 | 1421997 | 1769.13 | 3671 | 3612 | 801.7 |
| A | 14 | 237 | 813748 | 1010.47 | 3671 | 3612 | 801.7 |
| B | 2 | 32 | 17930613 | 27102.2 | 3459 | 3367 | 661.5 |
| B | 2 | 48 | 7008705 | 10590.59 | 3459 | 3367 | 661.5 |
| B | 4 | 239 | 3692096 | 5576.58 | 3459 | 3367 | 661.5 |
| C | 14 | 234 | 174854 | 213.88 | 3606 | 3562 | 800.9 |
| C | 15 | 208 | 168891 | 206.43 | 3606 | 3562 | 800.9 |
| C | 6 | 96 | 26905 | 29.15 | 3606 | 3562 | 800.9 |
| D | 1 | 52 | 13121982 | 15693.7 | 3522 | 3392 | 835.9 |
| D | 10 | 199 | 1322847 | 1578.46 | 3522 | 3392 | 835.9 |
| D | 10 | 157 | 1045496 | 1246.66 | 3522 | 3392 | 835.9 |
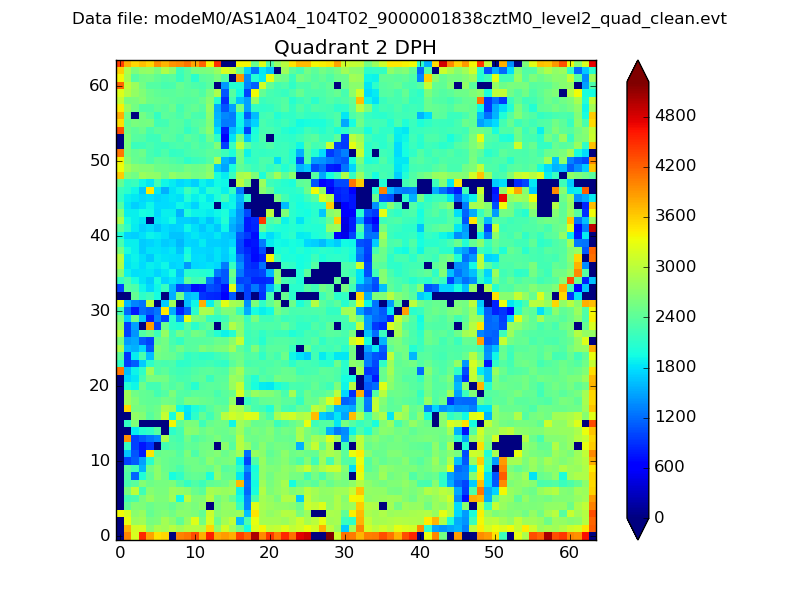
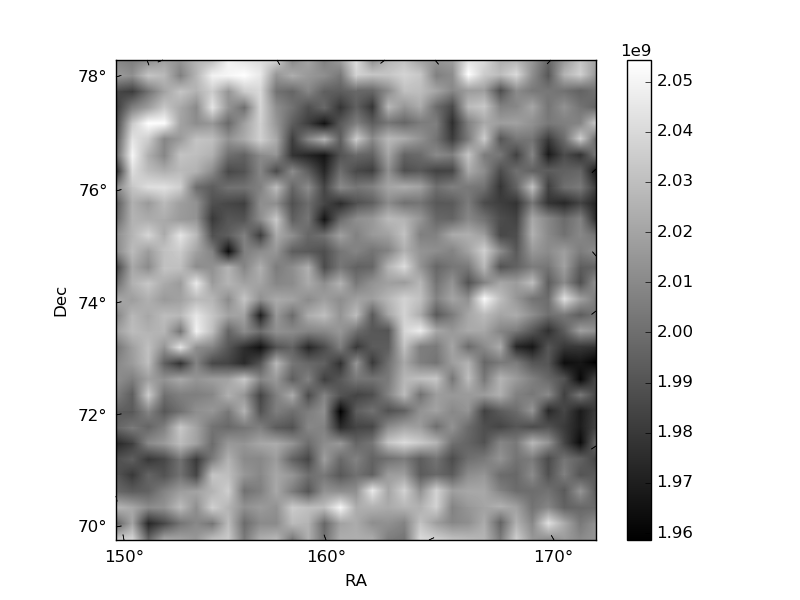
Histogram calculated using DETX and DETY for each event in the final _common_clean file
| Quadrant A | 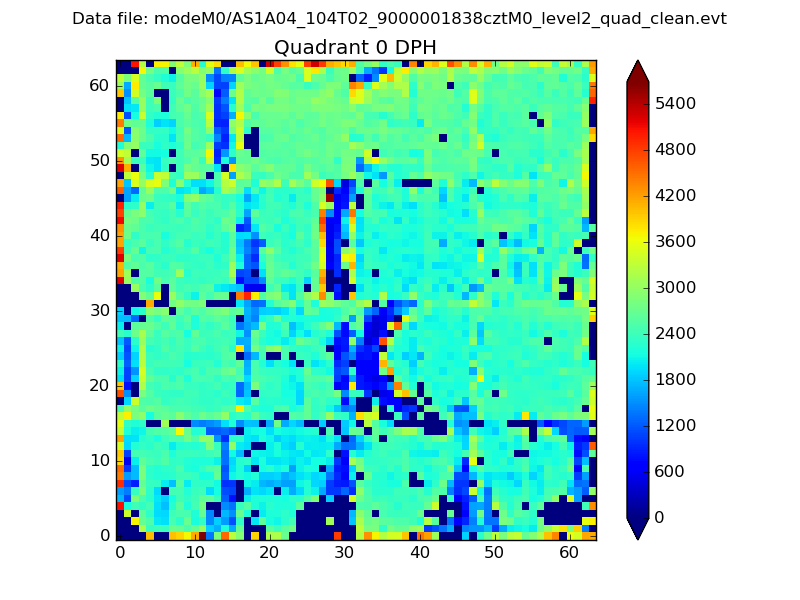 |
 |
Quadrant B |
|---|---|---|---|
| Quadrant D |  |
 |
Quadrant C |
| Plot type | Count rate plots | Images |
|---|---|---|
| Comparison with Poisson distribution Blue bars denote a histogram of data divided into 1 sec bins. Red curve is a Poisson curve with rate = median count rate of data. |
 |
 |
| Quadrant-wise count rates Data is divided into 100 sec bins |
 |
|
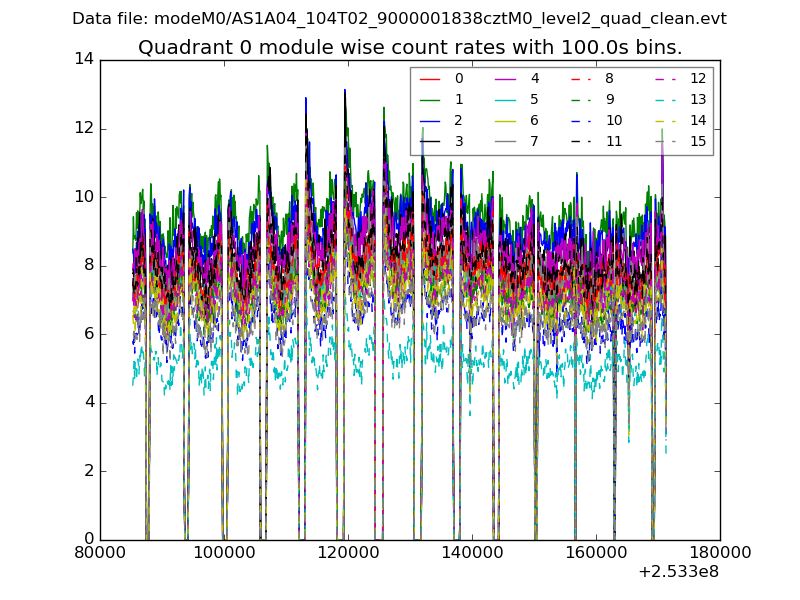
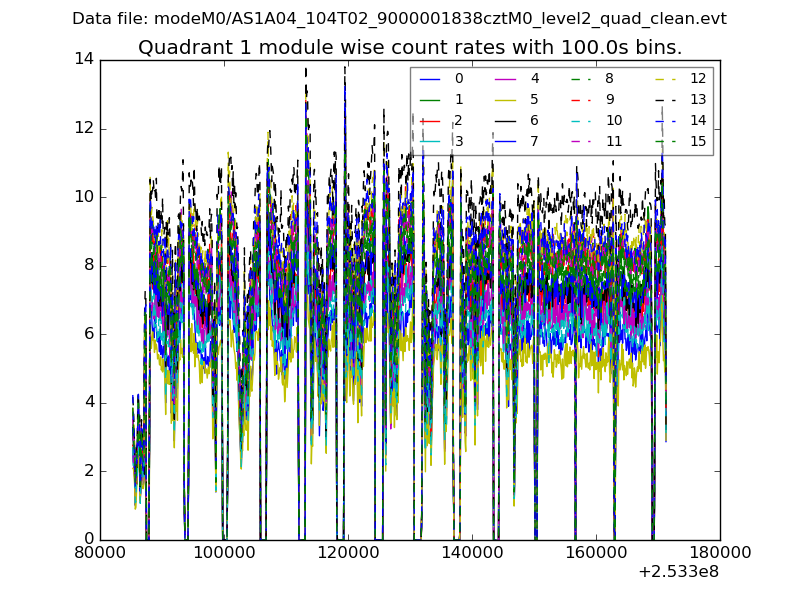
| Module-wise count rates for Quadrant A Data is divided into 100 sec bins |
 |
 |
| Module-wise count rates for Quadrant B Data is divided into 100 sec bins |
 |
 |
| Module-wise count rates for Quadrant C Data is divided into 100 sec bins |
 |
 |
| Module-wise count rates for Quadrant D Data is divided into 100 sec bins |
 |
 |
| Parameter | Plot |
|---|---|
| CZT HV Monitor |  |
| D_VDD |  |
| Temperature 1 | 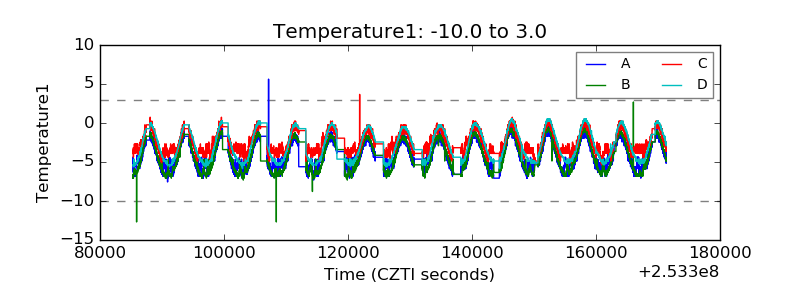 |
| Veto HV Monitor |  |
| Veto LLD |  |
| Alpha Counter |  |
| _CPM_Rate |  |
| CZT Counter |  |
| +2.5 Volts monitor |  |
| +5 Volts monitor | 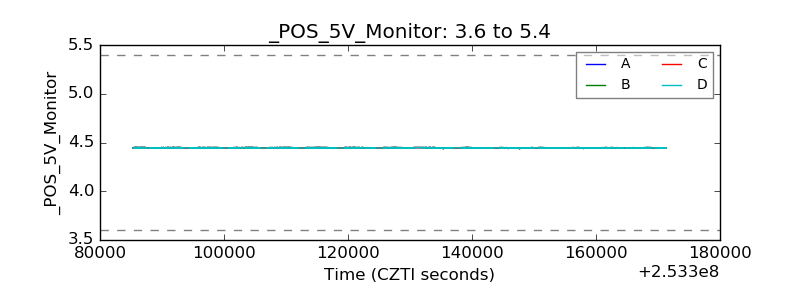 |
| _ROLL_ROT | 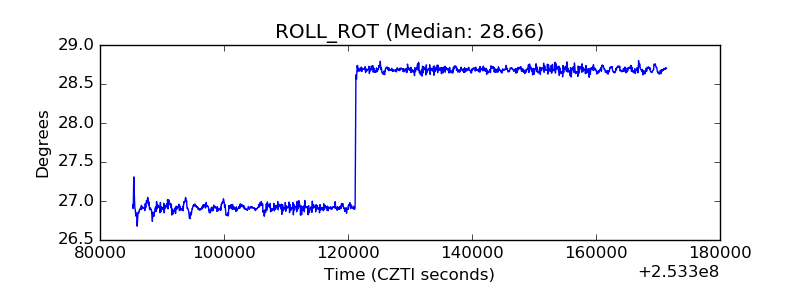 |
| _Roll_DEC |  |
| _Roll_RA |  |
| Veto Counter |  |