| Param | Original file | Final file |
|---|---|---|
| Filename | modeM0/AS1G08_072T03_9000001836cztM0_level2_bc.evt | modeM0/AS1G08_072T03_9000001836cztM0_level2_quad_clean.evt |
| Size (bytes) | 4,476,931,200 | 848,537,280 |
| Size | 4.2 GB | 809.2 MB |
| Events in quadrant A | 19,934,252 | 5,445,345 |
| Events in quadrant B | 67,568,866 | 4,565,857 |
| Events in quadrant C | 19,159,472 | 5,470,108 |
| Events in quadrant D | 23,898,540 | 5,152,359 |
| Mode M9 | |||
|---|---|---|---|
| Quadrant | BADHDUFLAG | Total packets | Discarded packets |
| A | 0 | 116 | 0 |
| B | 0 | 116 | 0 |
| C | 0 | 116 | 0 |
| D | 0 | 116 | 0 |
| Mode M0 | |||
|---|---|---|---|
| Quadrant | BADHDUFLAG | Total packets | Discarded packets |
| A | 0 | 180312 | 0 |
| B | 0 | 333571 | 0 |
| C | 0 | 167489 | 0 |
| D | 0 | 183883 | 0 |
| Mode SS | |||
|---|---|---|---|
| Quadrant | BADHDUFLAG | Total packets | Discarded packets |
| A | 0 | 1506 | 0 |
| B | 0 | 1506 | 0 |
| C | 0 | 1506 | 0 |
| D | 0 | 1506 | 0 |
| Quadrant | Total seconds | Saturated seconds | Saturation percentage |
|---|---|---|---|
| A | 73815 | 1659 | 2.247511% |
| B | 73815 | 27218 | 36.873264% |
| C | 73815 | 1679 | 2.274605% |
| D | 73815 | 3342 | 4.527535% |
Noise dominated data is calculated using 1-second bins in cleaned event files. If a bin has >2000 counts, and if more than 50% of those come from <1% of pixels, then it is considered to be noise-dominated and hence unusable.
| Quadrant | # 1 sec bins | Bins with >0 counts | Bins with >2000 counts | High rate bins dominated by noise | Noise dominated (total time) | Noise dominated (detector-on time) | Marked lightcurve |
|---|---|---|---|---|---|---|---|
| A | 85435 | 73801 | 4 | 4 | 0.00% | 0.01% |  |
| B | 85436 | 73805 | 12862 | 12862 | 15.05% | 17.43% |  |
| C | 85435 | 73807 | 111 | 111 | 0.13% | 0.15% |  |
| D | 85436 | 73806 | 918 | 918 | 1.07% | 1.24% |  |
Top three noisy pixels from each quadrant. If the there are fewer than three noisy pixels in the level2.evt file, extra rows are filled as -1
| Pixel properties | Quadrant properties | ||||||
|---|---|---|---|---|---|---|---|
| Quadrant | DetID | PixID | Counts | Sigma | Mean | Median | Sigma |
| A | 13 | 251 | 1921099 | 2371.84 | 3730 | 3658 | 808.4 |
| A | 8 | 15 | 1269565 | 1565.91 | 3730 | 3658 | 808.4 |
| A | 1 | 162 | 1193044 | 1471.25 | 3730 | 3658 | 808.4 |
| B | 2 | 32 | 30264666 | 52980.88 | 2993 | 2912 | 571.2 |
| B | 2 | 48 | 21242130 | 37184.64 | 2993 | 2912 | 571.2 |
| B | 4 | 239 | 2498076 | 4368.42 | 2993 | 2912 | 571.2 |
| C | 15 | 208 | 4254637 | 5220.19 | 3713 | 3661 | 814.3 |
| C | 12 | 4 | 167371 | 201.04 | 3713 | 3661 | 814.3 |
| C | 14 | 234 | 166522 | 199.99 | 3713 | 3661 | 814.3 |
| D | 1 | 52 | 6372121 | 7611.9 | 3672 | 3547 | 836.7 |
| D | 10 | 199 | 1038108 | 1236.54 | 3672 | 3547 | 836.7 |
| D | 10 | 157 | 737371 | 877.09 | 3672 | 3547 | 836.7 |
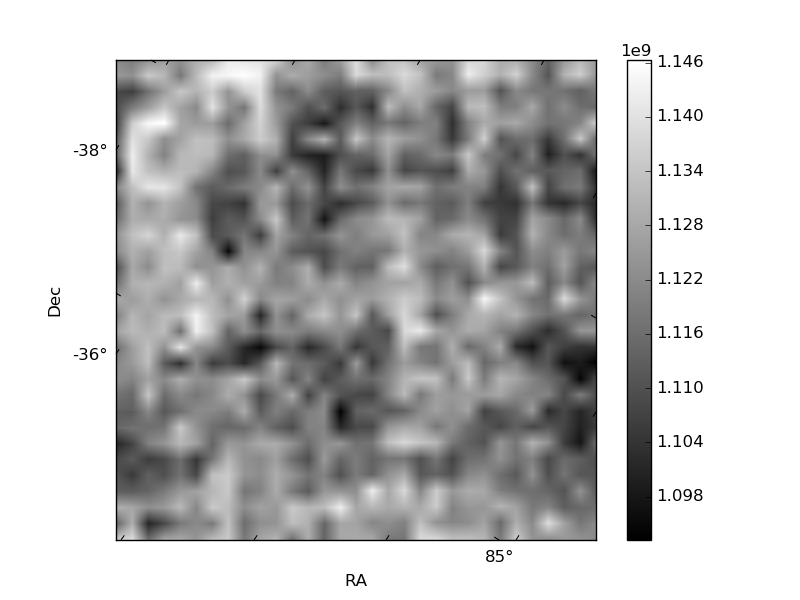
Histogram calculated using DETX and DETY for each event in the final _common_clean file
| Quadrant A |  |
 |
Quadrant B |
|---|---|---|---|
| Quadrant D |  |
 |
Quadrant C |
| Plot type | Count rate plots | Images |
|---|---|---|
| Comparison with Poisson distribution Blue bars denote a histogram of data divided into 1 sec bins. Red curve is a Poisson curve with rate = median count rate of data. |
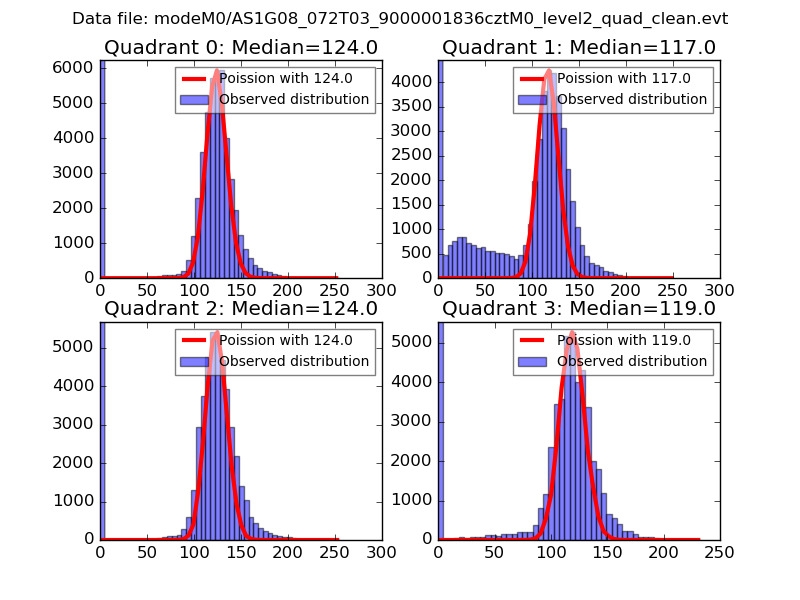 |
 |
| Quadrant-wise count rates Data is divided into 100 sec bins |
 |
|
| Module-wise count rates for Quadrant A Data is divided into 100 sec bins |
 |
 |
| Module-wise count rates for Quadrant B Data is divided into 100 sec bins |
 |
 |
| Module-wise count rates for Quadrant C Data is divided into 100 sec bins |
 |
 |
| Module-wise count rates for Quadrant D Data is divided into 100 sec bins |
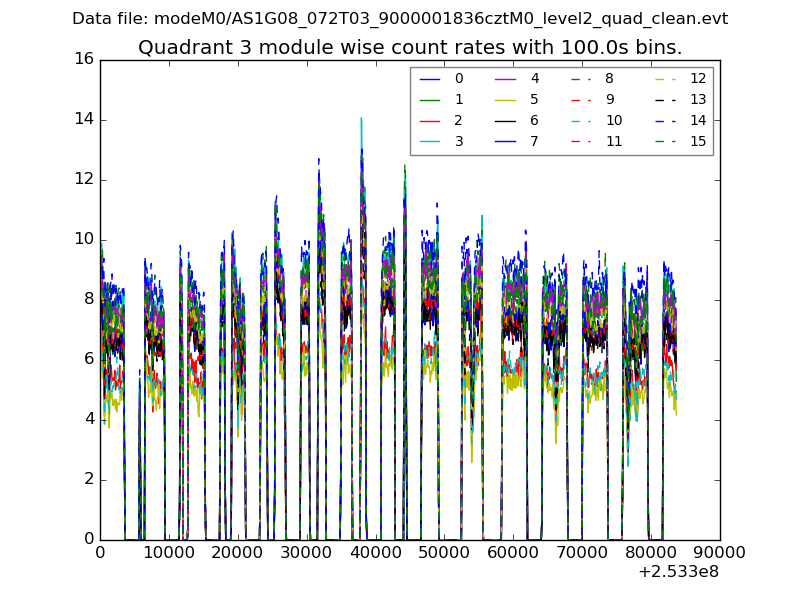 |
 |
| Parameter | Plot |
|---|---|
| CZT HV Monitor |  |
| D_VDD |  |
| Temperature 1 | 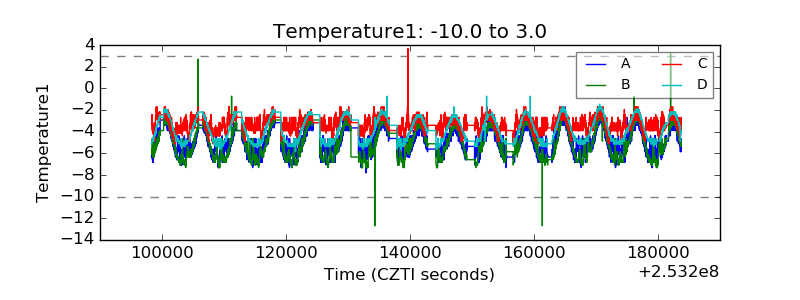 |
| Veto HV Monitor |  |
| Veto LLD |  |
| Alpha Counter |  |
| _CPM_Rate |  |
| CZT Counter |  |
| +2.5 Volts monitor | 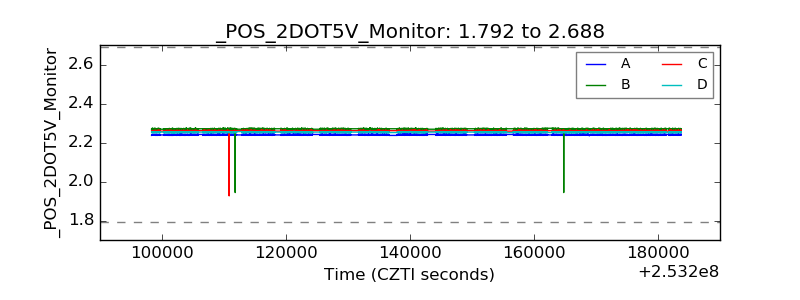 |
| +5 Volts monitor |  |
| _ROLL_ROT | 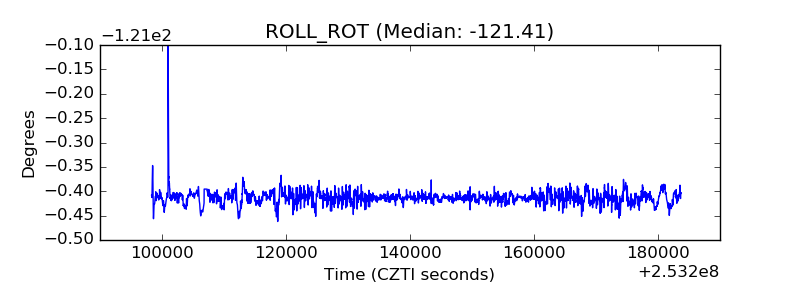 |
| _Roll_DEC |  |
| _Roll_RA |  |
| Veto Counter |  |