| Param | Original file | Final file |
|---|---|---|
| Filename | modeM0/AS1A04_212T01_9000001834cztM0_level2_bc.evt | modeM0/AS1A04_212T01_9000001834cztM0_level2_quad_clean.evt |
| Size (bytes) | 431,239,680 | 190,468,800 |
| Size | 411.3 MB | 181.6 MB |
| Events in quadrant A | 3,795,003 | 1,270,009 |
| Events in quadrant B | 2,859,943 | 1,298,205 |
| Events in quadrant C | 2,288,462 | 1,255,121 |
| Events in quadrant D | 3,383,257 | 1,207,138 |
| Mode SS | |||
|---|---|---|---|
| Quadrant | BADHDUFLAG | Total packets | Discarded packets |
| A | 0 | 218 | 0 |
| B | 0 | 218 | 0 |
| C | 0 | 218 | 0 |
| D | 0 | 218 | 0 |
| Mode M0 | |||
|---|---|---|---|
| Quadrant | BADHDUFLAG | Total packets | Discarded packets |
| A | 0 | 29154 | 0 |
| B | 0 | 24559 | 0 |
| C | 0 | 22725 | 0 |
| D | 0 | 26298 | 0 |
| Mode M9 | |||
|---|---|---|---|
| Quadrant | BADHDUFLAG | Total packets | Discarded packets |
| A | 0 | 6 | 0 |
| B | 0 | 6 | 0 |
| C | 0 | 6 | 0 |
| D | 0 | 6 | 0 |
| Quadrant | Total seconds | Saturated seconds | Saturation percentage |
|---|---|---|---|
| A | 10663 | 372 | 3.488699% |
| B | 10663 | 179 | 1.678702% |
| C | 10663 | 151 | 1.416112% |
| D | 10663 | 327 | 3.066679% |
Noise dominated data is calculated using 1-second bins in cleaned event files. If a bin has >2000 counts, and if more than 50% of those come from <1% of pixels, then it is considered to be noise-dominated and hence unusable.
| Quadrant | # 1 sec bins | Bins with >0 counts | Bins with >2000 counts | High rate bins dominated by noise | Noise dominated (total time) | Noise dominated (detector-on time) | Marked lightcurve |
|---|---|---|---|---|---|---|---|
| A | 11254 | 10664 | 0 | 0 | 0.00% | 0.00% |  |
| B | 11253 | 10663 | 2 | 2 | 0.02% | 0.02% |  |
| C | 11253 | 10663 | 6 | 6 | 0.05% | 0.06% |  |
| D | 11253 | 10663 | 28 | 28 | 0.25% | 0.26% |  |
Top three noisy pixels from each quadrant. If the there are fewer than three noisy pixels in the level2.evt file, extra rows are filled as -1
| Pixel properties | Quadrant properties | ||||||
|---|---|---|---|---|---|---|---|
| Quadrant | DetID | PixID | Counts | Sigma | Mean | Median | Sigma |
| A | 8 | 15 | 939715 | 8123.25 | 511 | 499 | 115.6 |
| A | 13 | 251 | 646531 | 5587.51 | 511 | 499 | 115.6 |
| A | 1 | 162 | 166597 | 1436.58 | 511 | 499 | 115.6 |
| B | 4 | 239 | 482345 | 4681.17 | 519 | 506 | 102.9 |
| B | 10 | 245 | 147272 | 1425.86 | 519 | 506 | 102.9 |
| B | 0 | 85 | 49849 | 479.38 | 519 | 506 | 102.9 |
| C | 15 | 208 | 280891 | 2470.41 | 497 | 490 | 113.5 |
| C | 14 | 234 | 39218 | 341.2 | 497 | 490 | 113.5 |
| C | 8 | 128 | 8936 | 74.41 | 497 | 490 | 113.5 |
| D | 1 | 52 | 698880 | 5769.86 | 500 | 480 | 121.0 |
| D | 13 | 104 | 376066 | 3102.92 | 500 | 480 | 121.0 |
| D | 5 | 222 | 86513 | 710.77 | 500 | 480 | 121.0 |
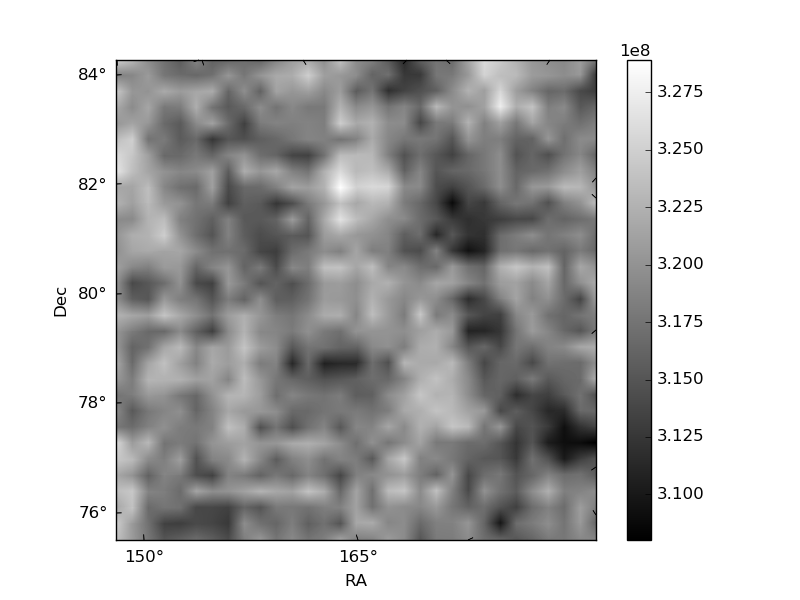
Histogram calculated using DETX and DETY for each event in the final _common_clean file
| Quadrant A | 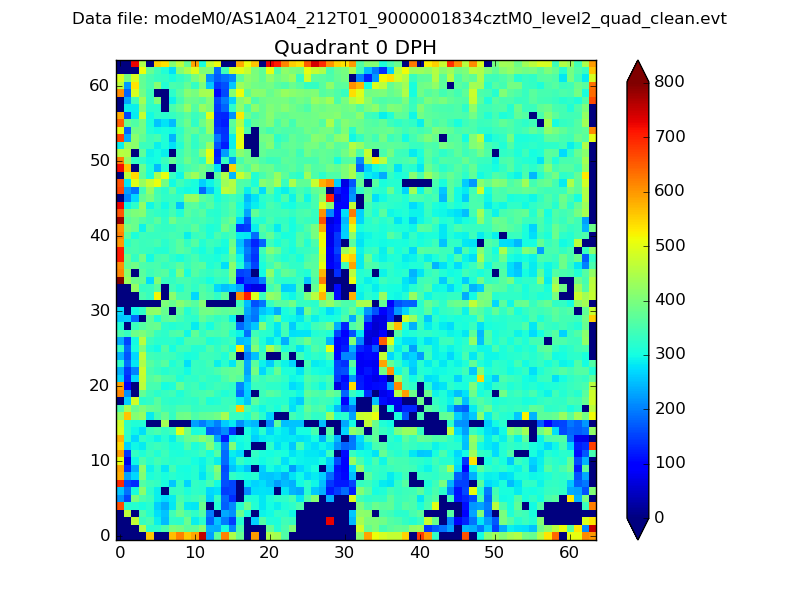 |
 |
Quadrant B |
|---|---|---|---|
| Quadrant D |  |
 |
Quadrant C |
| Plot type | Count rate plots | Images |
|---|---|---|
| Comparison with Poisson distribution Blue bars denote a histogram of data divided into 1 sec bins. Red curve is a Poisson curve with rate = median count rate of data. |
 |
 |
| Quadrant-wise count rates Data is divided into 100 sec bins |
 |
|
| Module-wise count rates for Quadrant A Data is divided into 100 sec bins |
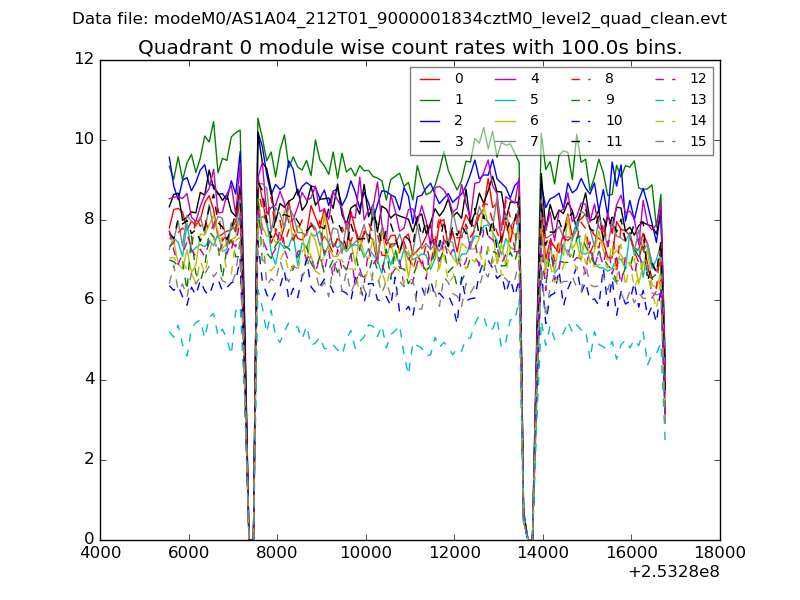 |
 |
| Module-wise count rates for Quadrant B Data is divided into 100 sec bins |
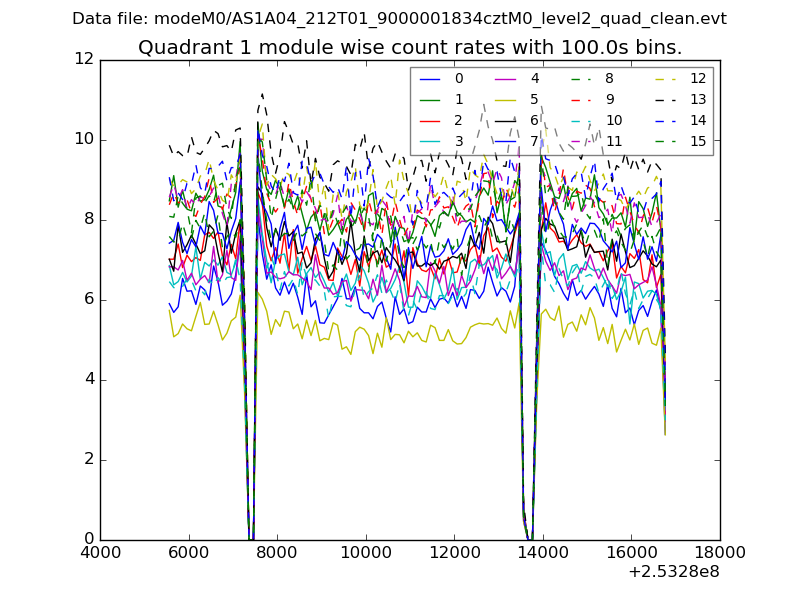 |
 |
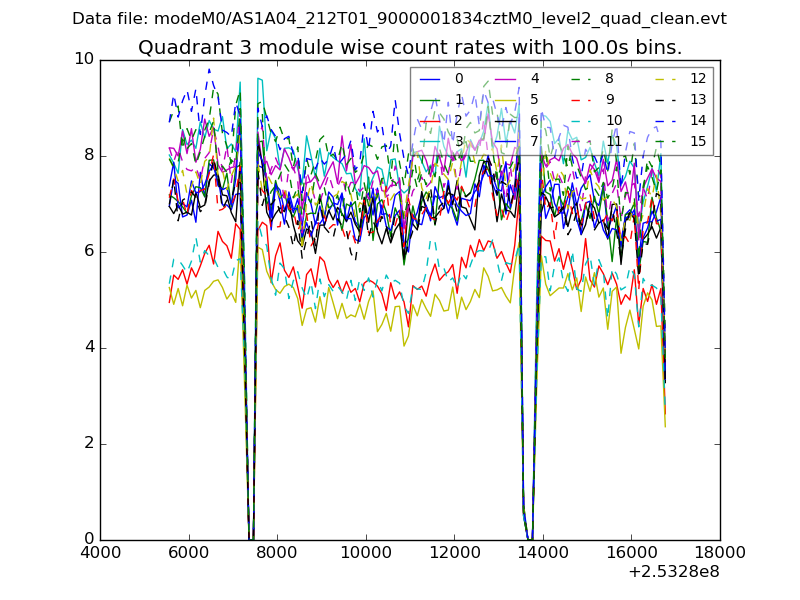
| Module-wise count rates for Quadrant C Data is divided into 100 sec bins |
 |
 |
| Module-wise count rates for Quadrant D Data is divided into 100 sec bins |
 |
 |
| Parameter | Plot |
|---|---|
| CZT HV Monitor |  |
| D_VDD |  |
| Temperature 1 |  |
| Veto HV Monitor |  |
| Veto LLD |  |
| Alpha Counter |  |
| _CPM_Rate |  |
| CZT Counter | 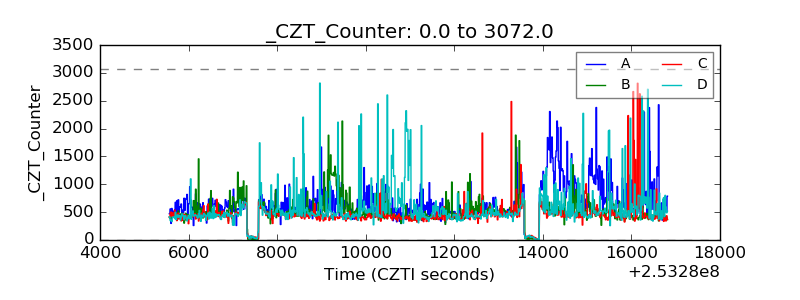 |
| +2.5 Volts monitor | 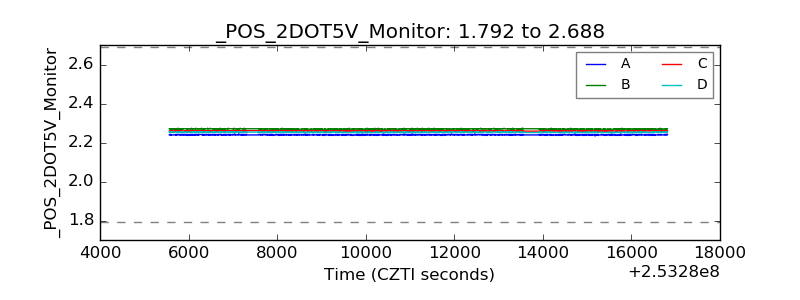 |
| +5 Volts monitor | 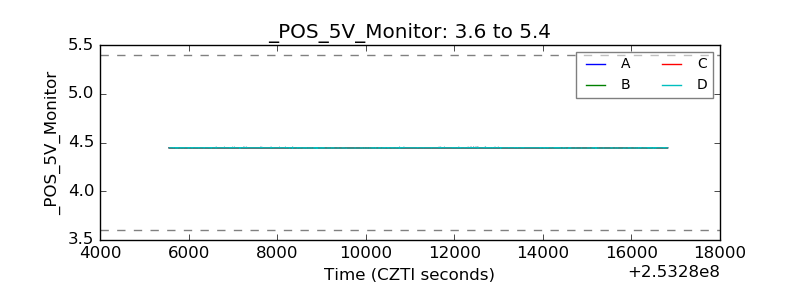 |
| _ROLL_ROT |  |
| _Roll_DEC |  |
| _Roll_RA |  |
| Veto Counter |  |