| Param | Original file | Final file |
|---|---|---|
| Filename | modeM0/AS1A04_130T04_9000001832cztM0_level2_bc.evt | modeM0/AS1A04_130T04_9000001832cztM0_level2_quad_clean.evt |
| Size (bytes) | 1,273,184,640 | 384,549,120 |
| Size | 1.2 GB | 366.7 MB |
| Events in quadrant A | 10,127,059 | 2,373,314 |
| Events in quadrant B | 8,664,197 | 2,416,883 |
| Events in quadrant C | 6,967,500 | 2,379,668 |
| Events in quadrant D | 10,586,487 | 2,248,346 |
| Mode SS | |||
|---|---|---|---|
| Quadrant | BADHDUFLAG | Total packets | Discarded packets |
| A | 0 | 664 | 0 |
| B | 0 | 664 | 0 |
| C | 0 | 664 | 0 |
| D | 0 | 664 | 0 |
| Mode M0 | |||
|---|---|---|---|
| Quadrant | BADHDUFLAG | Total packets | Discarded packets |
| A | 0 | 84964 | 0 |
| B | 0 | 74126 | 0 |
| C | 0 | 68245 | 0 |
| D | 0 | 79845 | 0 |
| Mode M9 | |||
|---|---|---|---|
| Quadrant | BADHDUFLAG | Total packets | Discarded packets |
| A | 0 | 62 | 0 |
| B | 0 | 62 | 0 |
| C | 0 | 62 | 0 |
| D | 0 | 62 | 0 |
| Quadrant | Total seconds | Saturated seconds | Saturation percentage |
|---|---|---|---|
| A | 32419 | 800 | 2.467689% |
| B | 32419 | 865 | 2.668188% |
| C | 32419 | 372 | 1.147475% |
| D | 32419 | 1296 | 3.997656% |
Noise dominated data is calculated using 1-second bins in cleaned event files. If a bin has >2000 counts, and if more than 50% of those come from <1% of pixels, then it is considered to be noise-dominated and hence unusable.
| Quadrant | # 1 sec bins | Bins with >0 counts | Bins with >2000 counts | High rate bins dominated by noise | Noise dominated (total time) | Noise dominated (detector-on time) | Marked lightcurve |
|---|---|---|---|---|---|---|---|
| A | 38780 | 32422 | 2 | 2 | 0.01% | 0.01% |  |
| B | 38780 | 32420 | 6 | 6 | 0.02% | 0.02% |  |
| C | 38780 | 32420 | 5 | 5 | 0.01% | 0.02% |  |
| D | 38780 | 32420 | 264 | 264 | 0.68% | 0.81% |  |
Top three noisy pixels from each quadrant. If the there are fewer than three noisy pixels in the level2.evt file, extra rows are filled as -1
| Pixel properties | Quadrant properties | ||||||
|---|---|---|---|---|---|---|---|
| Quadrant | DetID | PixID | Counts | Sigma | Mean | Median | Sigma |
| A | 8 | 15 | 1448758 | 3939.86 | 1688 | 1655 | 367.3 |
| A | 13 | 251 | 1378978 | 3749.88 | 1688 | 1655 | 367.3 |
| A | 1 | 162 | 570462 | 1548.63 | 1688 | 1655 | 367.3 |
| B | 4 | 239 | 1031164 | 3208.2 | 1700 | 1658 | 320.9 |
| B | 10 | 245 | 481390 | 1494.97 | 1700 | 1658 | 320.9 |
| B | 0 | 219 | 112164 | 344.36 | 1700 | 1658 | 320.9 |
| C | 15 | 208 | 411449 | 1146.01 | 1640 | 1615 | 357.6 |
| C | 14 | 234 | 125401 | 346.14 | 1640 | 1615 | 357.6 |
| C | 0 | 207 | 11093 | 26.5 | 1640 | 1615 | 357.6 |
| D | 1 | 52 | 3043709 | 8085.01 | 1637 | 1578 | 376.3 |
| D | 13 | 104 | 241350 | 637.24 | 1637 | 1578 | 376.3 |
| D | 5 | 222 | 224931 | 593.6 | 1637 | 1578 | 376.3 |
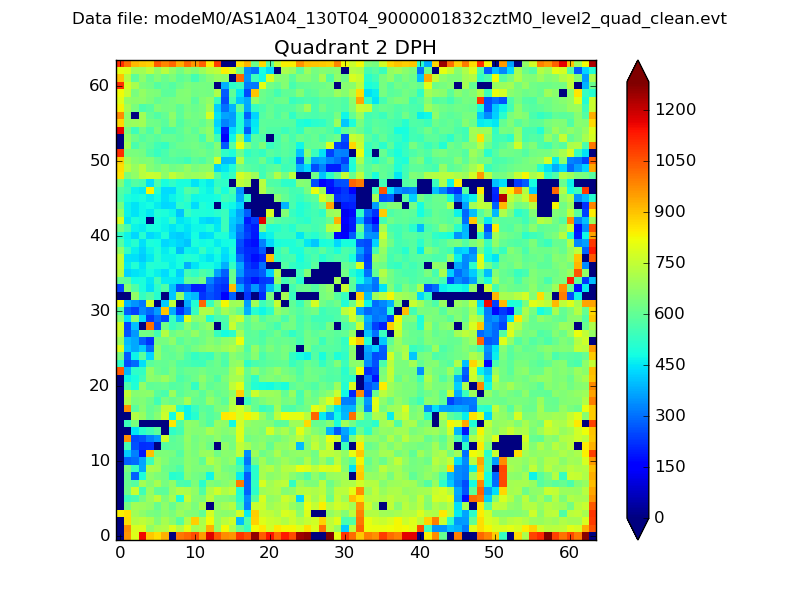
Histogram calculated using DETX and DETY for each event in the final _common_clean file
| Quadrant A | 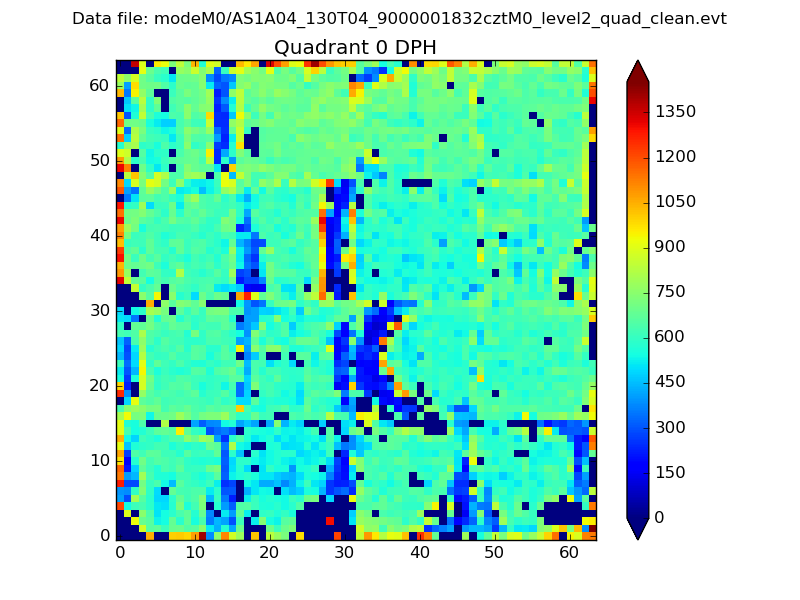 |
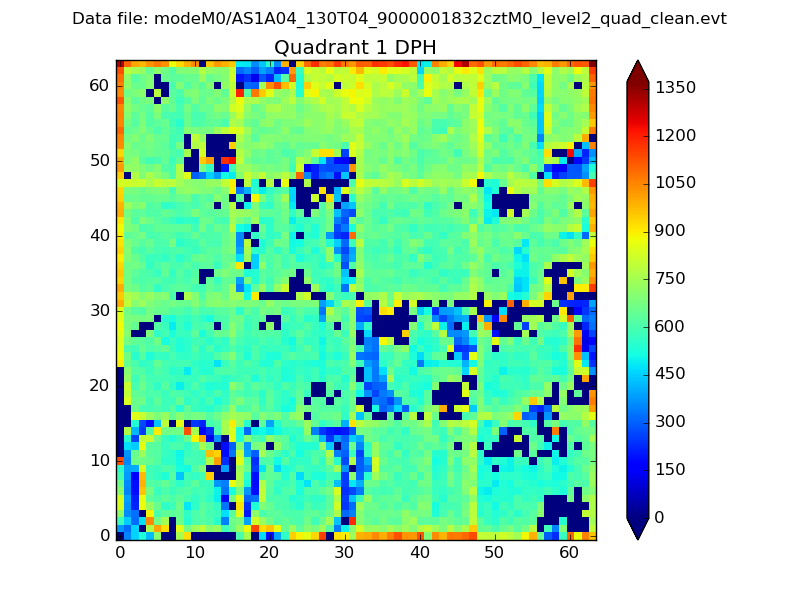 |
Quadrant B |
|---|---|---|---|
| Quadrant D | 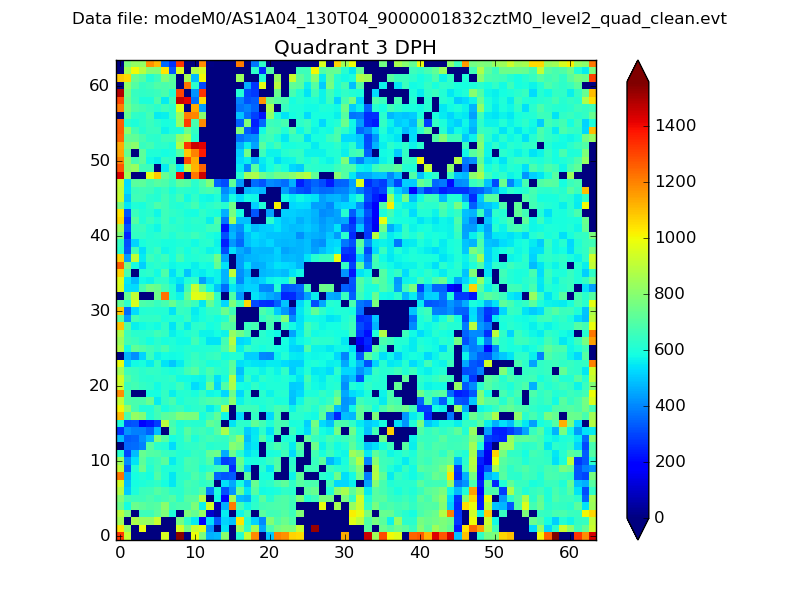 |
 |
Quadrant C |
| Plot type | Count rate plots | Images |
|---|---|---|
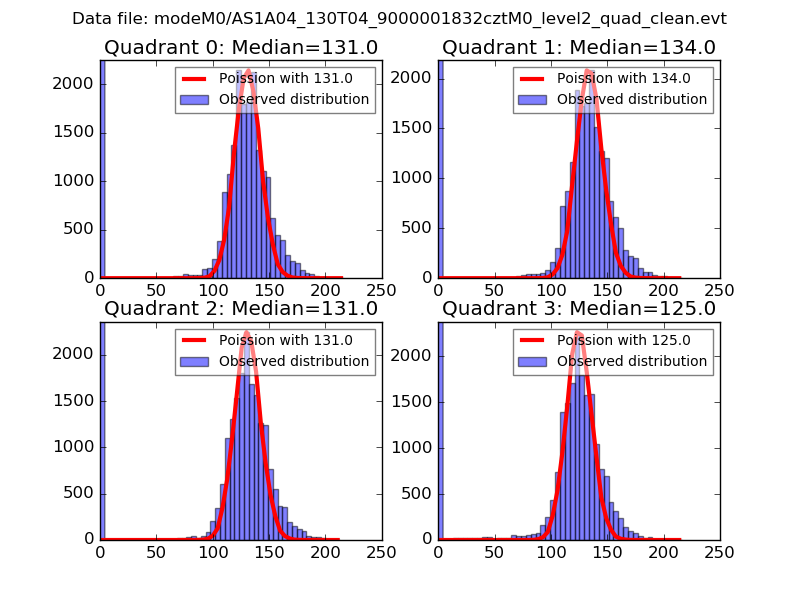
| Comparison with Poisson distribution Blue bars denote a histogram of data divided into 1 sec bins. Red curve is a Poisson curve with rate = median count rate of data. |
 |
 |
| Quadrant-wise count rates Data is divided into 100 sec bins |
 |
|
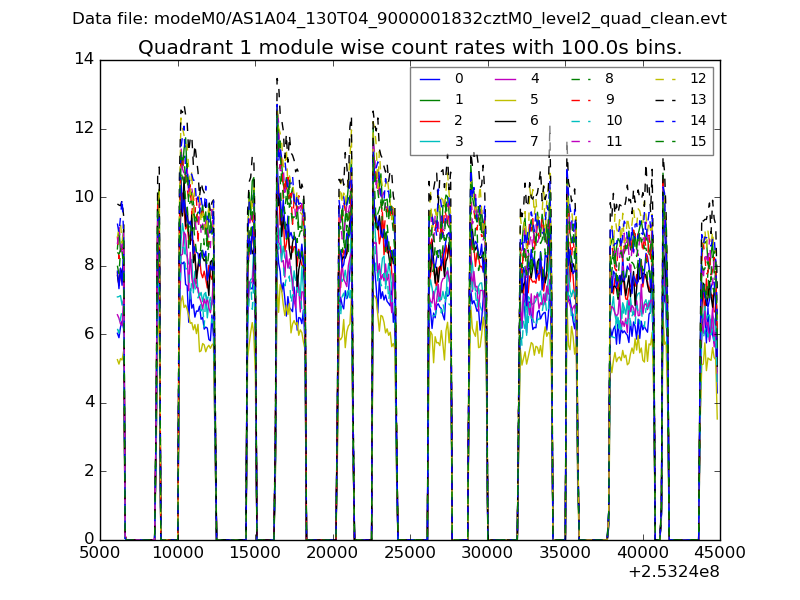
| Module-wise count rates for Quadrant A Data is divided into 100 sec bins |
 |
 |
| Module-wise count rates for Quadrant B Data is divided into 100 sec bins |
 |
 |
| Module-wise count rates for Quadrant C Data is divided into 100 sec bins |
 |
 |
| Module-wise count rates for Quadrant D Data is divided into 100 sec bins |
 |
 |
| Parameter | Plot |
|---|---|
| CZT HV Monitor |  |
| D_VDD |  |
| Temperature 1 |  |
| Veto HV Monitor |  |
| Veto LLD | 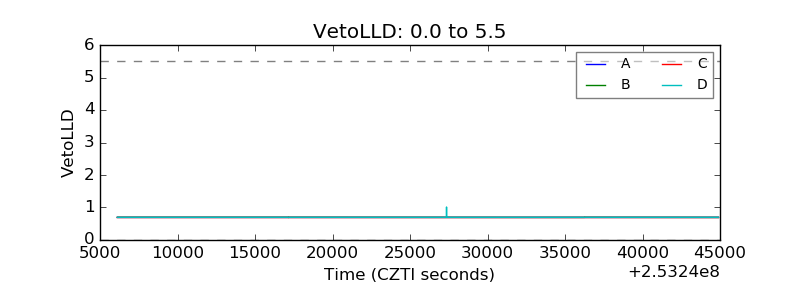 |
| Alpha Counter |  |
| _CPM_Rate |  |
| CZT Counter |  |
| +2.5 Volts monitor |  |
| +5 Volts monitor |  |
| _ROLL_ROT |  |
| _Roll_DEC | 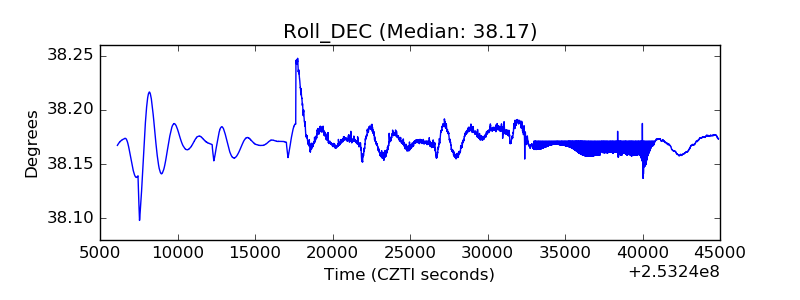 |
| _Roll_RA | 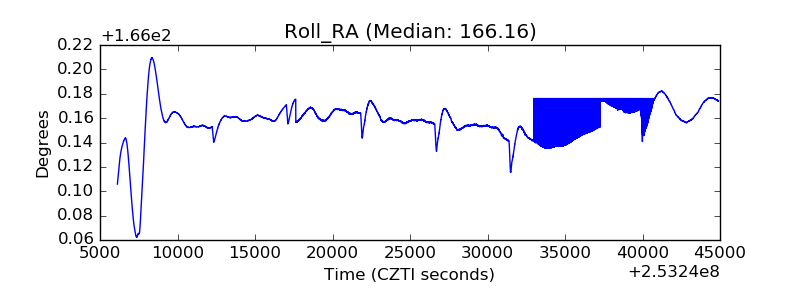 |
| Veto Counter | 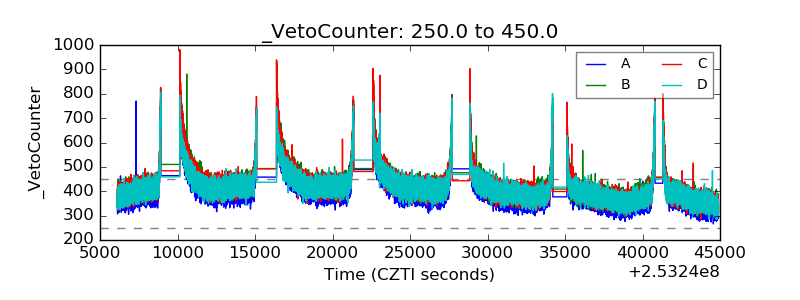 |