| Param | Original file | Final file |
|---|---|---|
| Filename | modeM0/AS1A04_210T02_9000001826cztM0_level2_bc.evt | modeM0/AS1A04_210T02_9000001826cztM0_level2_quad_clean.evt |
| Size (bytes) | 603,259,200 | 180,319,680 |
| Size | 575.3 MB | 172.0 MB |
| Events in quadrant A | 4,988,072 | 1,104,556 |
| Events in quadrant B | 3,695,950 | 1,145,340 |
| Events in quadrant C | 2,874,415 | 1,136,372 |
| Events in quadrant D | 5,699,932 | 1,057,317 |
| Mode M9 | |||
|---|---|---|---|
| Quadrant | BADHDUFLAG | Total packets | Discarded packets |
| A | 0 | 11 | 0 |
| B | 0 | 11 | 0 |
| C | 0 | 11 | 0 |
| D | 0 | 11 | 0 |
| Mode M0 | |||
|---|---|---|---|
| Quadrant | BADHDUFLAG | Total packets | Discarded packets |
| A | 0 | 39864 | 0 |
| B | 0 | 33562 | 0 |
| C | 0 | 30892 | 0 |
| D | 0 | 39518 | 0 |
| Mode SS | |||
|---|---|---|---|
| Quadrant | BADHDUFLAG | Total packets | Discarded packets |
| A | 0 | 300 | 0 |
| B | 0 | 300 | 0 |
| C | 0 | 300 | 0 |
| D | 0 | 300 | 0 |
| Quadrant | Total seconds | Saturated seconds | Saturation percentage |
|---|---|---|---|
| A | 14747 | 820 | 5.560453% |
| B | 14747 | 745 | 5.051875% |
| C | 14747 | 378 | 2.563233% |
| D | 14747 | 1088 | 7.377772% |
Noise dominated data is calculated using 1-second bins in cleaned event files. If a bin has >2000 counts, and if more than 50% of those come from <1% of pixels, then it is considered to be noise-dominated and hence unusable.
| Quadrant | # 1 sec bins | Bins with >0 counts | Bins with >2000 counts | High rate bins dominated by noise | Noise dominated (total time) | Noise dominated (detector-on time) | Marked lightcurve |
|---|---|---|---|---|---|---|---|
| A | 15808 | 14749 | 0 | 0 | 0.00% | 0.00% |  |
| B | 15808 | 14749 | 0 | 0 | 0.00% | 0.00% |  |
| C | 15808 | 14748 | 1 | 1 | 0.01% | 0.01% |  |
| D | 15808 | 14749 | 295 | 295 | 1.87% | 2.00% | 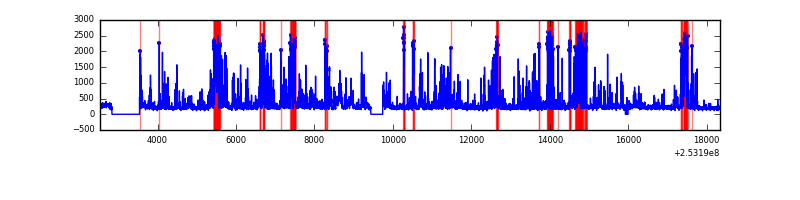 |
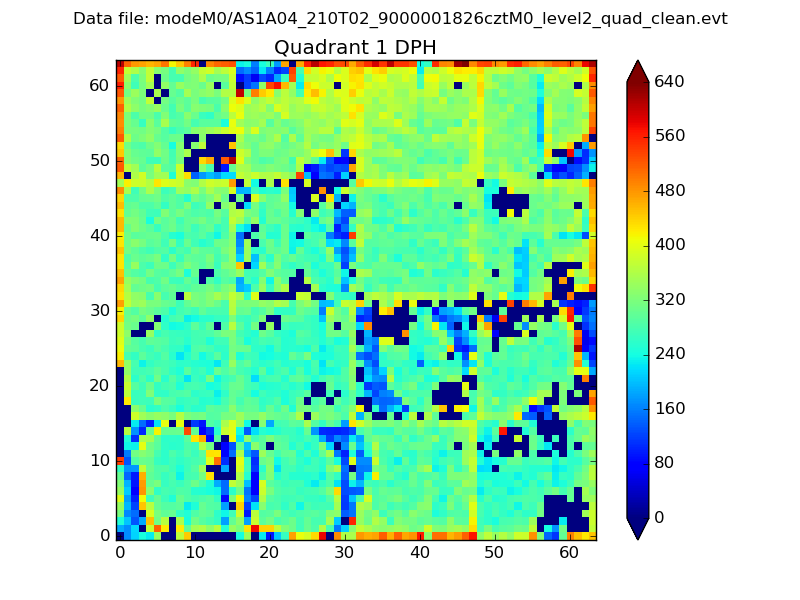
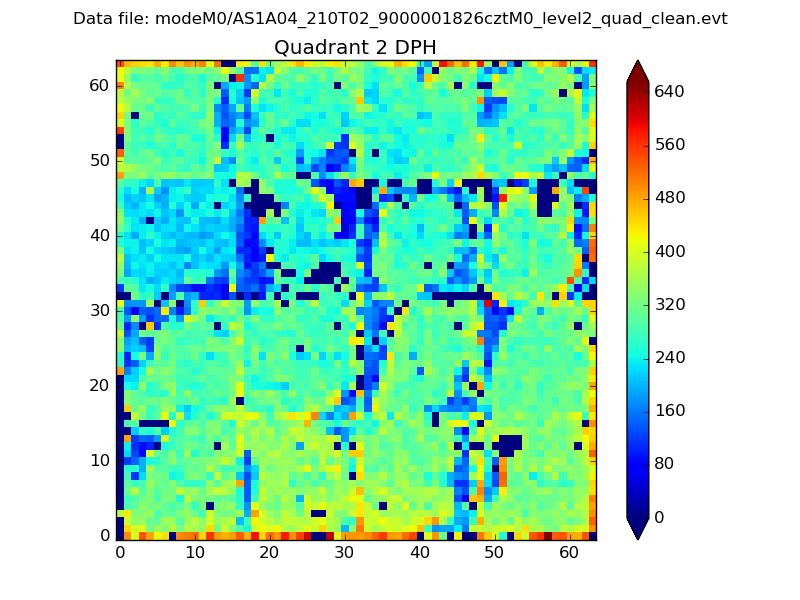
Top three noisy pixels from each quadrant. If the there are fewer than three noisy pixels in the level2.evt file, extra rows are filled as -1
| Pixel properties | Quadrant properties | ||||||
|---|---|---|---|---|---|---|---|
| Quadrant | DetID | PixID | Counts | Sigma | Mean | Median | Sigma |
| A | 8 | 15 | 1349054 | 8523.27 | 715 | 698 | 158.2 |
| A | 13 | 251 | 537012 | 3390.16 | 715 | 698 | 158.2 |
| A | 1 | 162 | 224911 | 1417.3 | 715 | 698 | 158.2 |
| B | 4 | 239 | 415206 | 2904.69 | 730 | 708 | 142.7 |
| B | 0 | 85 | 149536 | 1042.95 | 730 | 708 | 142.7 |
| B | 3 | 64 | 47502 | 327.92 | 730 | 708 | 142.7 |
| C | 15 | 208 | 44413 | 269.22 | 719 | 707 | 162.3 |
| C | 0 | 207 | 11537 | 66.71 | 719 | 707 | 162.3 |
| C | 8 | 222 | 4910 | 25.89 | 719 | 707 | 162.3 |
| D | 1 | 52 | 1989066 | 11737.64 | 708 | 680 | 169.4 |
| D | 14 | 34 | 434496 | 2560.86 | 708 | 680 | 169.4 |
| D | 13 | 104 | 143393 | 842.45 | 708 | 680 | 169.4 |
Histogram calculated using DETX and DETY for each event in the final _common_clean file
| Quadrant A |  |
 |
Quadrant B |
|---|---|---|---|
| Quadrant D |  |
 |
Quadrant C |
| Plot type | Count rate plots | Images |
|---|---|---|
| Comparison with Poisson distribution Blue bars denote a histogram of data divided into 1 sec bins. Red curve is a Poisson curve with rate = median count rate of data. |
 |
 |
| Quadrant-wise count rates Data is divided into 100 sec bins |
 |
|
| Module-wise count rates for Quadrant A Data is divided into 100 sec bins |
 |
 |
| Module-wise count rates for Quadrant B Data is divided into 100 sec bins |
 |
 |
| Module-wise count rates for Quadrant C Data is divided into 100 sec bins |
 |
 |
| Module-wise count rates for Quadrant D Data is divided into 100 sec bins |
 |
 |
| Parameter | Plot |
|---|---|
| CZT HV Monitor |  |
| D_VDD |  |
| Temperature 1 |  |
| Veto HV Monitor |  |
| Veto LLD |  |
| Alpha Counter | 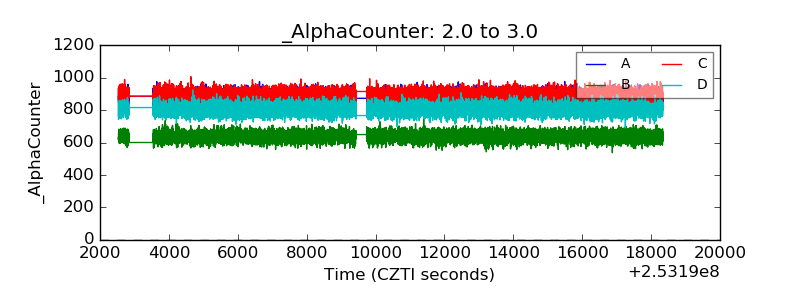 |
| _CPM_Rate |  |
| CZT Counter |  |
| +2.5 Volts monitor |  |
| +5 Volts monitor |  |
| _ROLL_ROT |  |
| _Roll_DEC |  |
| _Roll_RA |  |
| Veto Counter |  |