| Param | Original file | Final file |
|---|---|---|
| Filename | modeM0/AS1A04_210T01_9000001824cztM0_level2_bc.evt | modeM0/AS1A04_210T01_9000001824cztM0_level2_quad_clean.evt |
| Size (bytes) | 619,525,440 | 196,531,200 |
| Size | 590.8 MB | 187.4 MB |
| Events in quadrant A | 4,183,004 | 1,237,202 |
| Events in quadrant B | 4,325,479 | 1,269,635 |
| Events in quadrant C | 3,151,816 | 1,254,774 |
| Events in quadrant D | 6,070,121 | 1,151,783 |
| Mode SS | |||
|---|---|---|---|
| Quadrant | BADHDUFLAG | Total packets | Discarded packets |
| A | 0 | 306 | 0 |
| B | 0 | 306 | 0 |
| C | 0 | 306 | 0 |
| D | 0 | 306 | 0 |
| Mode M9 | |||
|---|---|---|---|
| Quadrant | BADHDUFLAG | Total packets | Discarded packets |
| A | 0 | 37 | 0 |
| B | 0 | 37 | 0 |
| C | 0 | 37 | 0 |
| D | 0 | 37 | 0 |
| Mode M0 | |||
|---|---|---|---|
| Quadrant | BADHDUFLAG | Total packets | Discarded packets |
| A | 0 | 37076 | 0 |
| B | 0 | 36306 | 0 |
| C | 0 | 31210 | 0 |
| D | 0 | 43727 | 0 |
| Quadrant | Total seconds | Saturated seconds | Saturation percentage |
|---|---|---|---|
| A | 15054 | 348 | 2.311678% |
| B | 15054 | 822 | 5.460343% |
| C | 15054 | 163 | 1.082769% |
| D | 15054 | 1148 | 7.625880% |
Noise dominated data is calculated using 1-second bins in cleaned event files. If a bin has >2000 counts, and if more than 50% of those come from <1% of pixels, then it is considered to be noise-dominated and hence unusable.
| Quadrant | # 1 sec bins | Bins with >0 counts | Bins with >2000 counts | High rate bins dominated by noise | Noise dominated (total time) | Noise dominated (detector-on time) | Marked lightcurve |
|---|---|---|---|---|---|---|---|
| A | 18665 | 15055 | 0 | 0 | 0.00% | 0.00% |  |
| B | 18665 | 15055 | 3 | 3 | 0.02% | 0.02% |  |
| C | 18665 | 15056 | 0 | 0 | 0.00% | 0.00% |  |
| D | 18665 | 15054 | 90 | 90 | 0.48% | 0.60% |  |
Top three noisy pixels from each quadrant. If the there are fewer than three noisy pixels in the level2.evt file, extra rows are filled as -1
| Pixel properties | Quadrant properties | ||||||
|---|---|---|---|---|---|---|---|
| Quadrant | DetID | PixID | Counts | Sigma | Mean | Median | Sigma |
| A | 13 | 251 | 454428 | 2644.96 | 802 | 788 | 171.5 |
| A | 8 | 15 | 368700 | 2145.12 | 802 | 788 | 171.5 |
| A | 1 | 162 | 206042 | 1196.74 | 802 | 788 | 171.5 |
| B | 15 | 201 | 590962 | 3865.39 | 809 | 789 | 152.7 |
| B | 4 | 239 | 350221 | 2288.64 | 809 | 789 | 152.7 |
| B | 0 | 85 | 70263 | 455.03 | 809 | 789 | 152.7 |
| C | 15 | 208 | 19755 | 110.41 | 791 | 782 | 171.8 |
| C | 14 | 225 | 15878 | 87.85 | 791 | 782 | 171.8 |
| C | 8 | 128 | 9480 | 50.62 | 791 | 782 | 171.8 |
| D | 1 | 52 | 2108517 | 12234.6 | 762 | 736 | 172.3 |
| D | 13 | 170 | 264280 | 1529.74 | 762 | 736 | 172.3 |
| D | 10 | 253 | 256981 | 1487.37 | 762 | 736 | 172.3 |
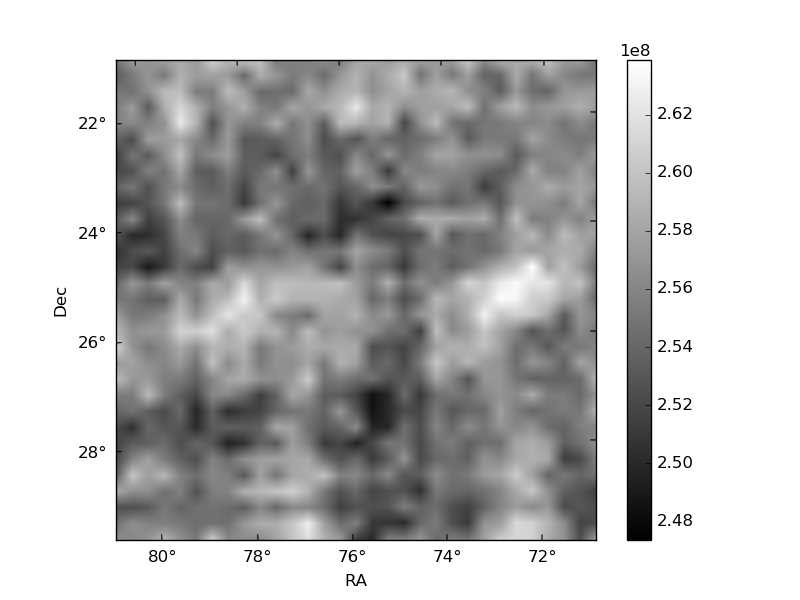
Histogram calculated using DETX and DETY for each event in the final _common_clean file
| Quadrant A |  |
 |
Quadrant B |
|---|---|---|---|
| Quadrant D | 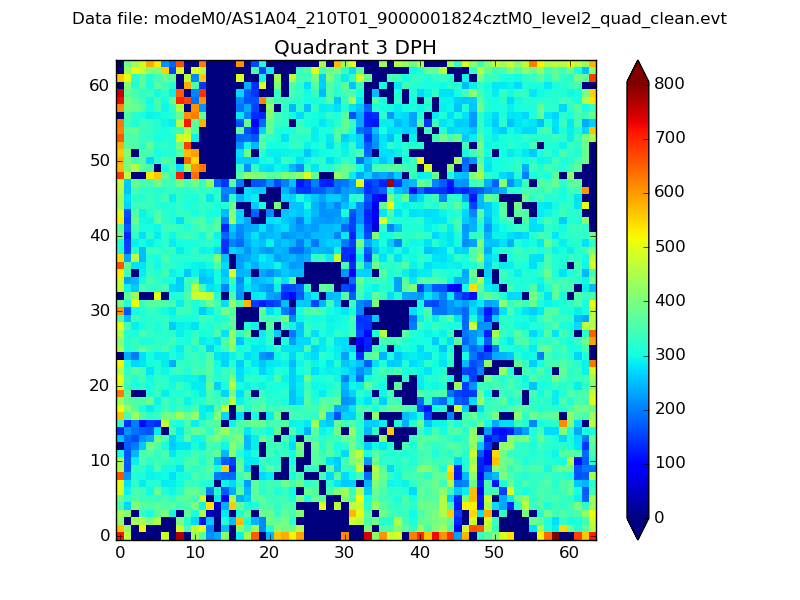 |
 |
Quadrant C |
| Plot type | Count rate plots | Images |
|---|---|---|
| Comparison with Poisson distribution Blue bars denote a histogram of data divided into 1 sec bins. Red curve is a Poisson curve with rate = median count rate of data. |
 |
 |
| Quadrant-wise count rates Data is divided into 100 sec bins |
 |
|
| Module-wise count rates for Quadrant A Data is divided into 100 sec bins |
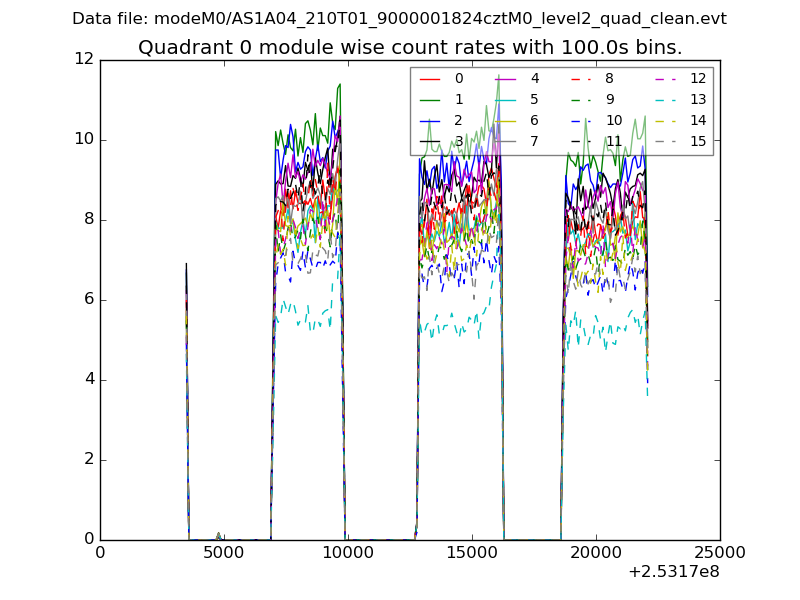 |
 |
| Module-wise count rates for Quadrant B Data is divided into 100 sec bins |
 |
 |
| Module-wise count rates for Quadrant C Data is divided into 100 sec bins |
 |
 |
| Module-wise count rates for Quadrant D Data is divided into 100 sec bins |
 |
 |
| Parameter | Plot |
|---|---|
| CZT HV Monitor |  |
| D_VDD |  |
| Temperature 1 | 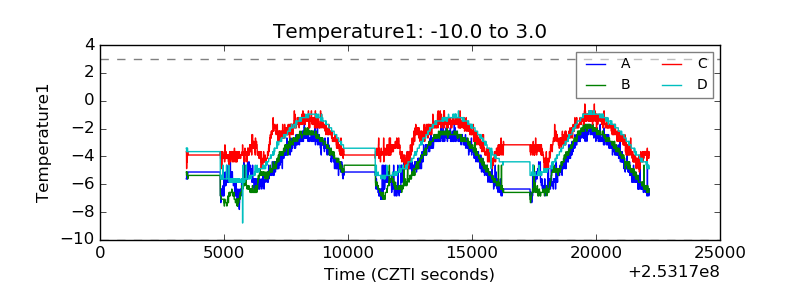 |
| Veto HV Monitor |  |
| Veto LLD |  |
| Alpha Counter |  |
| _CPM_Rate | 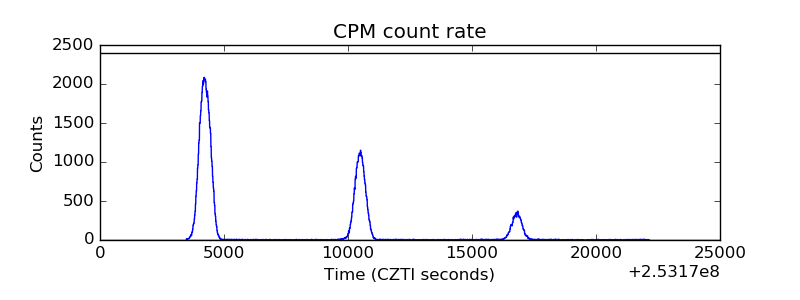 |
| CZT Counter | 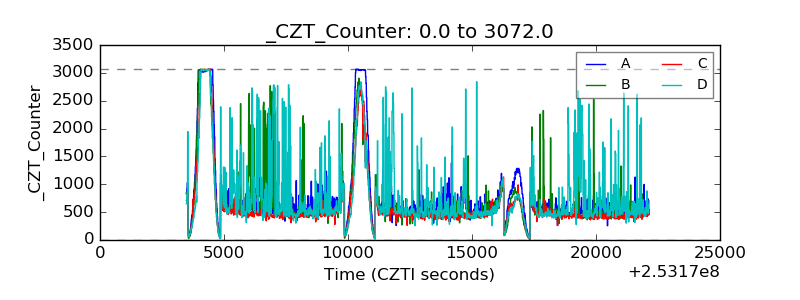 |
| +2.5 Volts monitor |  |
| +5 Volts monitor | 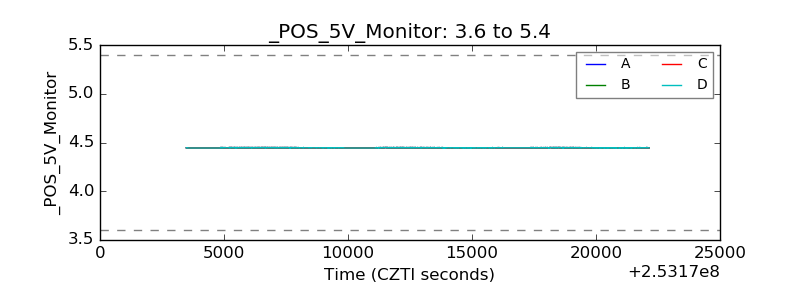 |
| _ROLL_ROT |  |
| _Roll_DEC |  |
| _Roll_RA | 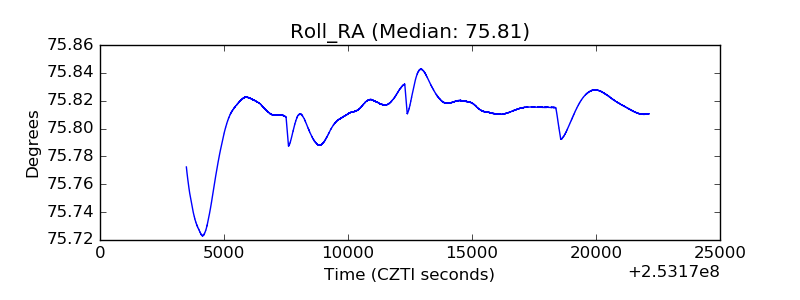 |
| Veto Counter |  |