| Param | Original file | Final file |
|---|---|---|
| Filename | modeM0/AS1A04_183T02_9000001816cztM0_level2_bc.evt | modeM0/AS1A04_183T02_9000001816cztM0_level2_quad_clean.evt |
| Size (bytes) | 5,257,998,720 | 1,593,178,560 |
| Size | 4.9 GB | 1.5 GB |
| Events in quadrant A | 36,350,237 | 9,862,719 |
| Events in quadrant B | 40,184,129 | 9,803,449 |
| Events in quadrant C | 27,669,436 | 10,089,818 |
| Events in quadrant D | 45,872,469 | 9,277,414 |
| Mode M9 | |||
|---|---|---|---|
| Quadrant | BADHDUFLAG | Total packets | Discarded packets |
| A | 0 | 207 | 0 |
| B | 0 | 207 | 0 |
| C | 0 | 207 | 0 |
| D | 0 | 207 | 0 |
| Mode SS | |||
|---|---|---|---|
| Quadrant | BADHDUFLAG | Total packets | Discarded packets |
| A | 0 | 2732 | 0 |
| B | 0 | 2732 | 0 |
| C | 0 | 2732 | 0 |
| D | 0 | 2732 | 0 |
| Mode M0 | |||
|---|---|---|---|
| Quadrant | BADHDUFLAG | Total packets | Discarded packets |
| A | 0 | 322575 | 0 |
| B | 0 | 337851 | 0 |
| C | 0 | 279935 | 0 |
| D | 0 | 352673 | 0 |
| Quadrant | Total seconds | Saturated seconds | Saturation percentage |
|---|---|---|---|
| A | 134568 | 3417 | 2.539237% |
| B | 134568 | 7191 | 5.343767% |
| C | 134568 | 1132 | 0.841210% |
| D | 134568 | 8548 | 6.352179% |
Noise dominated data is calculated using 1-second bins in cleaned event files. If a bin has >2000 counts, and if more than 50% of those come from <1% of pixels, then it is considered to be noise-dominated and hence unusable.
| Quadrant | # 1 sec bins | Bins with >0 counts | Bins with >2000 counts | High rate bins dominated by noise | Noise dominated (total time) | Noise dominated (detector-on time) | Marked lightcurve |
|---|---|---|---|---|---|---|---|
| A | 154308 | 134571 | 76 | 76 | 0.05% | 0.06% | 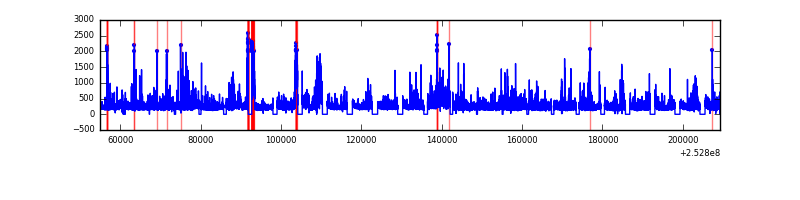 |
| B | 154308 | 134550 | 169 | 169 | 0.11% | 0.13% |  |
| C | 154308 | 134574 | 26 | 26 | 0.02% | 0.02% |  |
| D | 154308 | 134553 | 1172 | 1172 | 0.76% | 0.87% |  |
Top three noisy pixels from each quadrant. If the there are fewer than three noisy pixels in the level2.evt file, extra rows are filled as -1
| Pixel properties | Quadrant properties | ||||||
|---|---|---|---|---|---|---|---|
| Quadrant | DetID | PixID | Counts | Sigma | Mean | Median | Sigma |
| A | 0 | 23 | 4805325 | 3284.71 | 6773 | 6646 | 1460.9 |
| A | 1 | 162 | 1631353 | 1112.12 | 6773 | 6646 | 1460.9 |
| A | 11 | 29 | 1285711 | 875.52 | 6773 | 6646 | 1460.9 |
| B | 4 | 239 | 7544711 | 5940.57 | 6765 | 6584 | 1268.9 |
| B | 3 | 64 | 2120603 | 1666.0 | 6765 | 6584 | 1268.9 |
| B | 0 | 85 | 2001592 | 1572.21 | 6765 | 6584 | 1268.9 |
| C | 14 | 234 | 547899 | 367.7 | 6758 | 6680 | 1471.9 |
| C | 4 | 254 | 391226 | 261.26 | 6758 | 6680 | 1471.9 |
| C | 15 | 208 | 237458 | 156.79 | 6758 | 6680 | 1471.9 |
| D | 1 | 52 | 13110554 | 8718.13 | 6554 | 6320 | 1503.1 |
| D | 5 | 222 | 2511349 | 1666.57 | 6554 | 6320 | 1503.1 |
| D | 10 | 199 | 641513 | 422.59 | 6554 | 6320 | 1503.1 |
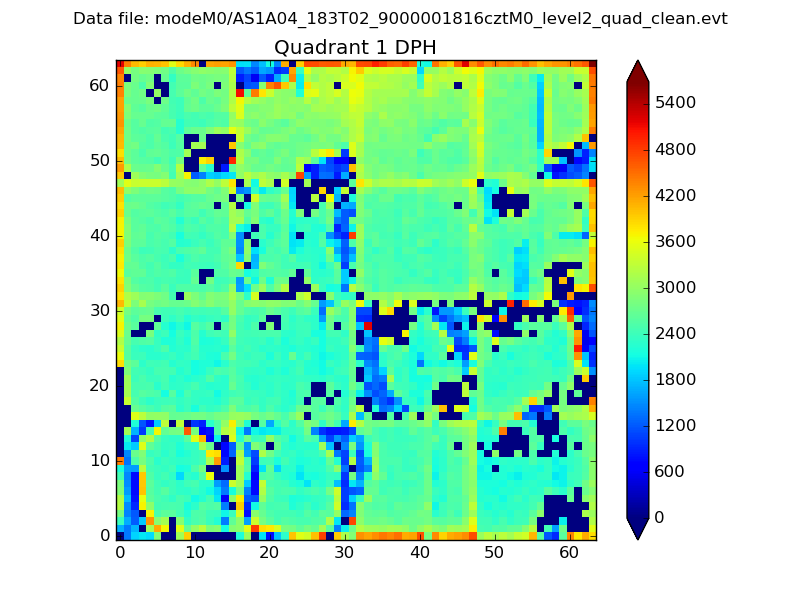
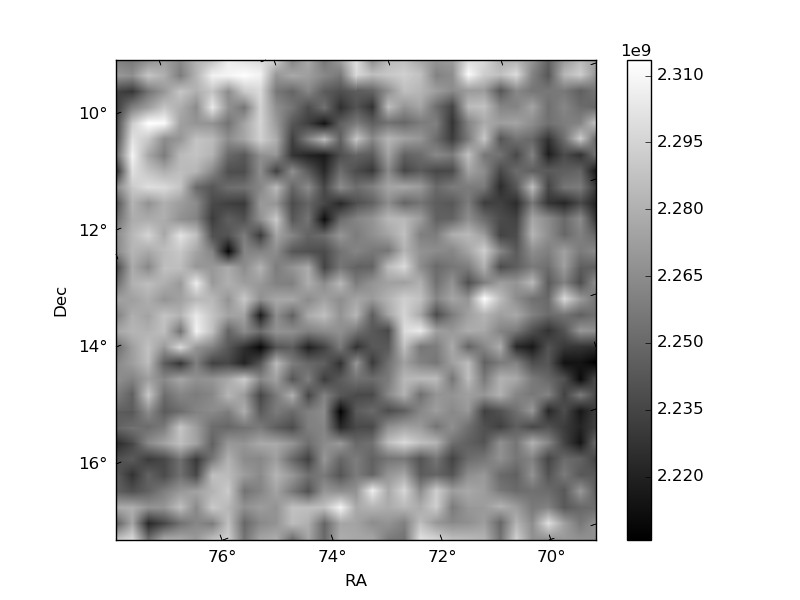
Histogram calculated using DETX and DETY for each event in the final _common_clean file
| Quadrant A |  |
 |
Quadrant B |
|---|---|---|---|
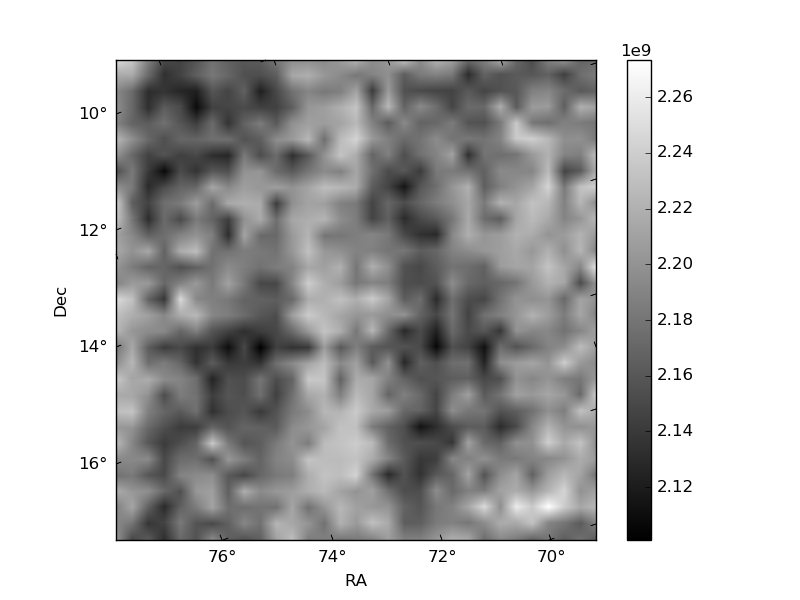
| Quadrant D | 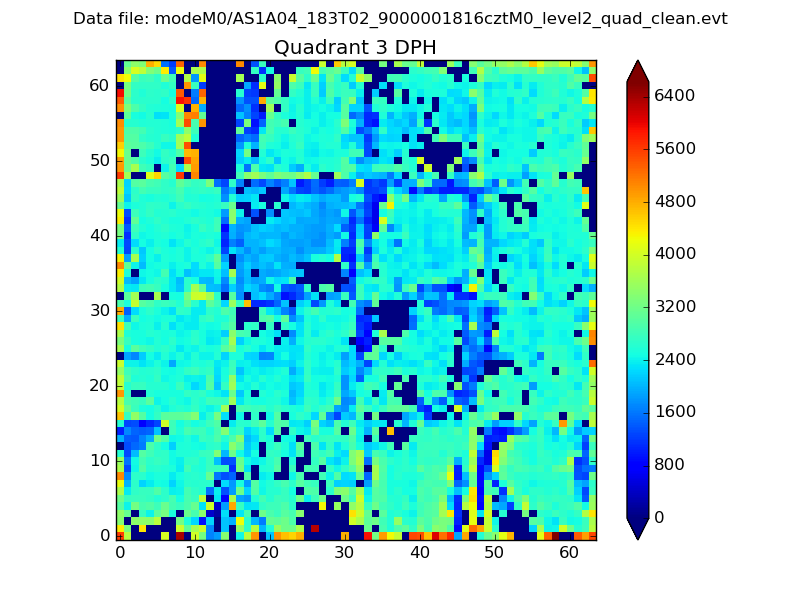 |
 |
Quadrant C |
| Plot type | Count rate plots | Images |
|---|---|---|
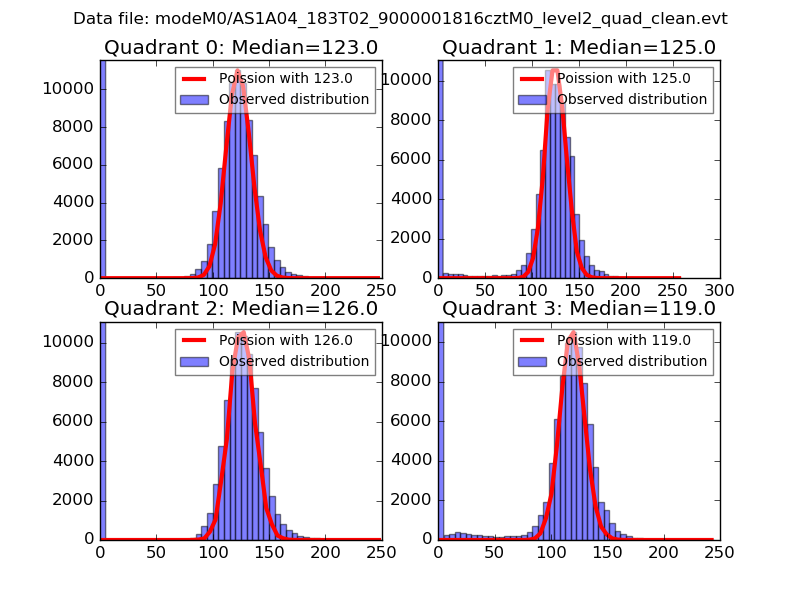
| Comparison with Poisson distribution Blue bars denote a histogram of data divided into 1 sec bins. Red curve is a Poisson curve with rate = median count rate of data. |
 |
 |
| Quadrant-wise count rates Data is divided into 100 sec bins |
 |
|
| Module-wise count rates for Quadrant A Data is divided into 100 sec bins |
 |
 |
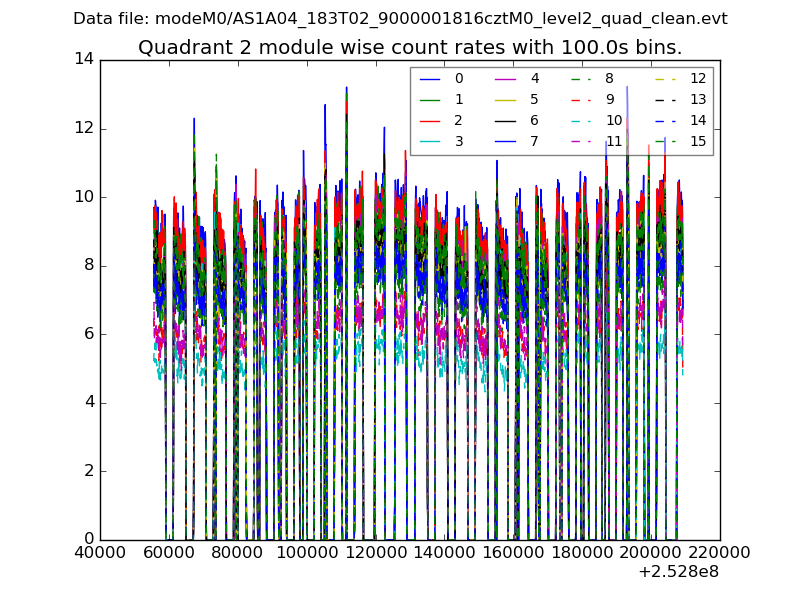
| Module-wise count rates for Quadrant B Data is divided into 100 sec bins |
 |
 |
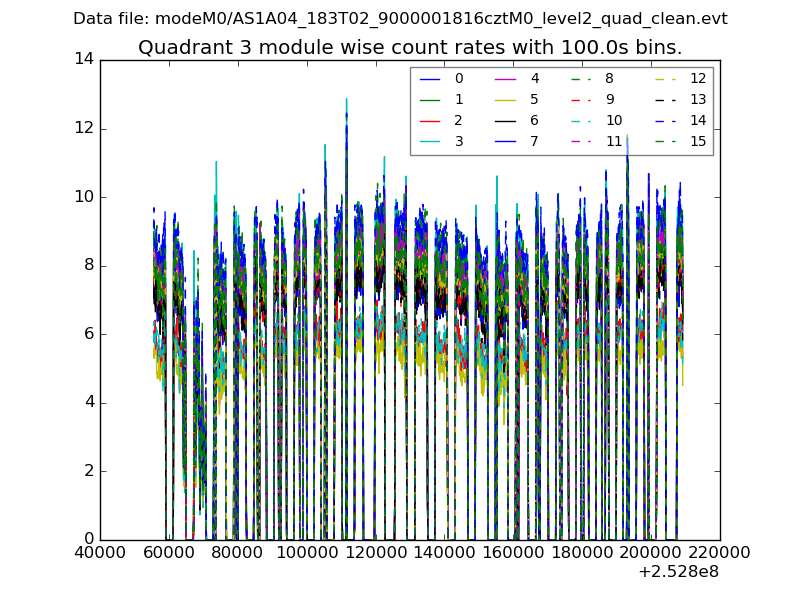
| Module-wise count rates for Quadrant C Data is divided into 100 sec bins |
 |
 |
| Module-wise count rates for Quadrant D Data is divided into 100 sec bins |
 |
 |
| Parameter | Plot |
|---|---|
| CZT HV Monitor |  |
| D_VDD | 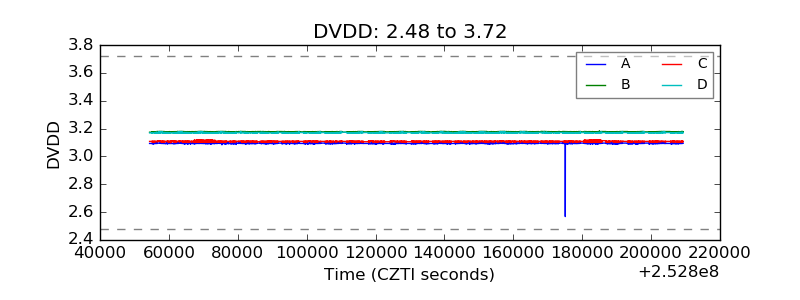 |
| Temperature 1 |  |
| Veto HV Monitor | 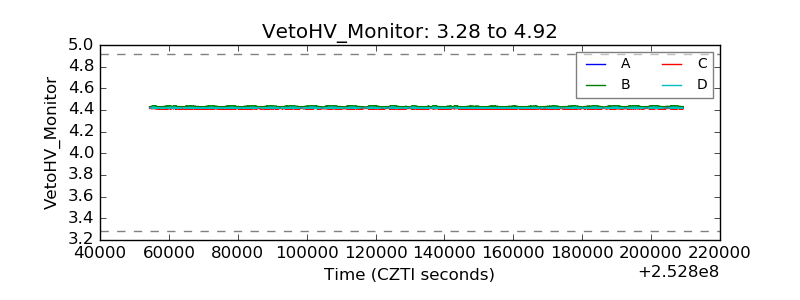 |
| Veto LLD | 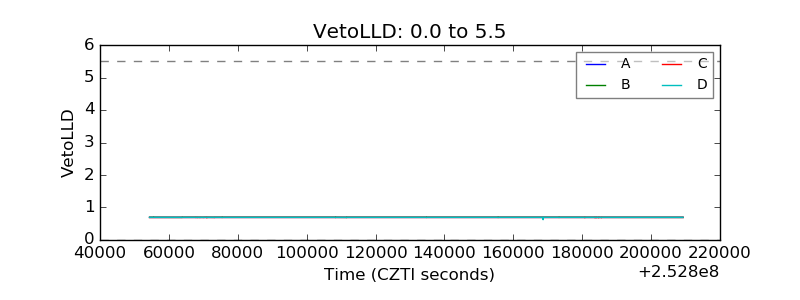 |
| Alpha Counter |  |
| _CPM_Rate |  |
| CZT Counter | 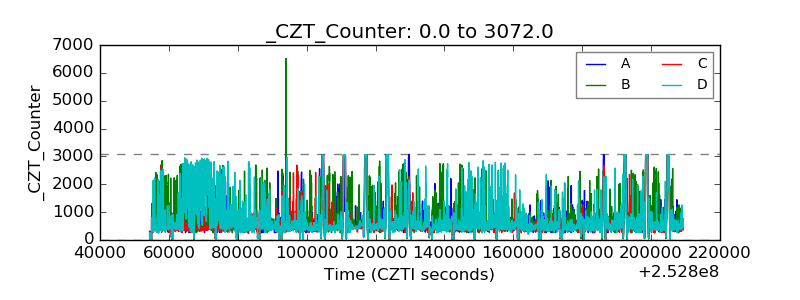 |
| +2.5 Volts monitor |  |
| +5 Volts monitor |  |
| _ROLL_ROT | 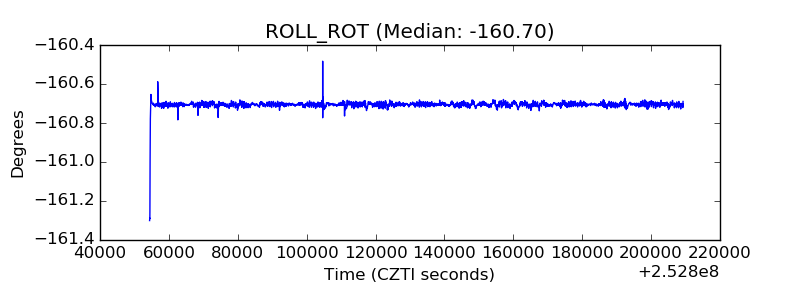 |
| _Roll_DEC |  |
| _Roll_RA |  |
| Veto Counter |  |