| Param | Original file | Final file |
|---|---|---|
| Filename | modeM0/AS1G08_064T01_9000001814cztM0_level2_bc.evt | modeM0/AS1G08_064T01_9000001814cztM0_level2_quad_clean.evt |
| Size (bytes) | 6,417,786,240 | 1,872,097,920 |
| Size | 6.0 GB | 1.7 GB |
| Events in quadrant A | 48,900,063 | 11,702,167 |
| Events in quadrant B | 55,924,297 | 11,557,499 |
| Events in quadrant C | 32,186,278 | 11,863,679 |
| Events in quadrant D | 47,120,125 | 11,281,269 |
| Mode M9 | |||
|---|---|---|---|
| Quadrant | BADHDUFLAG | Total packets | Discarded packets |
| A | 0 | 237 | 0 |
| B | 0 | 237 | 0 |
| C | 0 | 237 | 0 |
| D | 0 | 237 | 0 |
| Mode M0 | |||
|---|---|---|---|
| Quadrant | BADHDUFLAG | Total packets | Discarded packets |
| A | 0 | 389120 | 0 |
| B | 0 | 447570 | 0 |
| C | 0 | 314258 | 0 |
| D | 0 | 366304 | 0 |
| Mode SS | |||
|---|---|---|---|
| Quadrant | BADHDUFLAG | Total packets | Discarded packets |
| A | 0 | 3064 | 0 |
| B | 0 | 3064 | 0 |
| C | 0 | 3064 | 0 |
| D | 0 | 3064 | 0 |
| Quadrant | Total seconds | Saturated seconds | Saturation percentage |
|---|---|---|---|
| A | 150292 | 4933 | 3.282277% |
| B | 150293 | 19125 | 12.725144% |
| C | 150293 | 1313 | 0.873627% |
| D | 150293 | 4663 | 3.102606% |
Noise dominated data is calculated using 1-second bins in cleaned event files. If a bin has >2000 counts, and if more than 50% of those come from <1% of pixels, then it is considered to be noise-dominated and hence unusable.
| Quadrant | # 1 sec bins | Bins with >0 counts | Bins with >2000 counts | High rate bins dominated by noise | Noise dominated (total time) | Noise dominated (detector-on time) | Marked lightcurve |
|---|---|---|---|---|---|---|---|
| A | 173504 | 150300 | 279 | 279 | 0.16% | 0.19% | 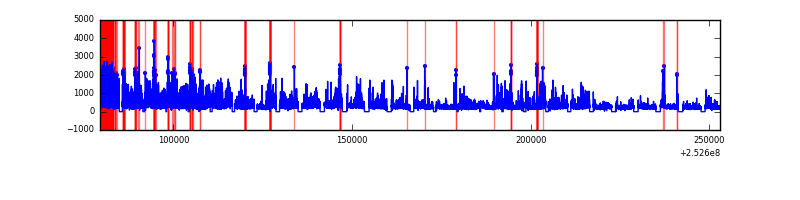 |
| B | 173504 | 150198 | 522 | 522 | 0.30% | 0.35% |  |
| C | 173504 | 150296 | 60 | 60 | 0.03% | 0.04% | 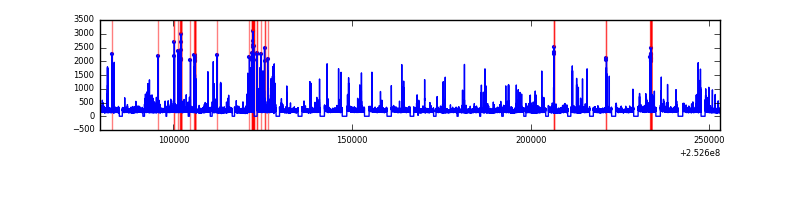 |
| D | 173504 | 150293 | 881 | 881 | 0.51% | 0.59% |  |
Top three noisy pixels from each quadrant. If the there are fewer than three noisy pixels in the level2.evt file, extra rows are filled as -1
| Pixel properties | Quadrant properties | ||||||
|---|---|---|---|---|---|---|---|
| Quadrant | DetID | PixID | Counts | Sigma | Mean | Median | Sigma |
| A | 13 | 251 | 8800426 | 5333.25 | 7571 | 7438 | 1648.7 |
| A | 8 | 15 | 4222390 | 2556.51 | 7571 | 7438 | 1648.7 |
| A | 14 | 237 | 1714032 | 1035.11 | 7571 | 7438 | 1648.7 |
| B | 4 | 239 | 16347244 | 12174.75 | 7102 | 6920 | 1342.1 |
| B | 0 | 85 | 5133066 | 3819.36 | 7102 | 6920 | 1342.1 |
| B | 3 | 64 | 2732745 | 2030.94 | 7102 | 6920 | 1342.1 |
| C | 15 | 208 | 1302217 | 796.3 | 7455 | 7361 | 1626.1 |
| C | 3 | 233 | 648055 | 394.01 | 7455 | 7361 | 1626.1 |
| C | 1 | 16 | 332854 | 200.17 | 7455 | 7361 | 1626.1 |
| D | 1 | 52 | 8923191 | 5164.11 | 7459 | 7198 | 1726.5 |
| D | 10 | 199 | 1285076 | 740.14 | 7459 | 7198 | 1726.5 |
| D | 12 | 221 | 1257084 | 723.93 | 7459 | 7198 | 1726.5 |
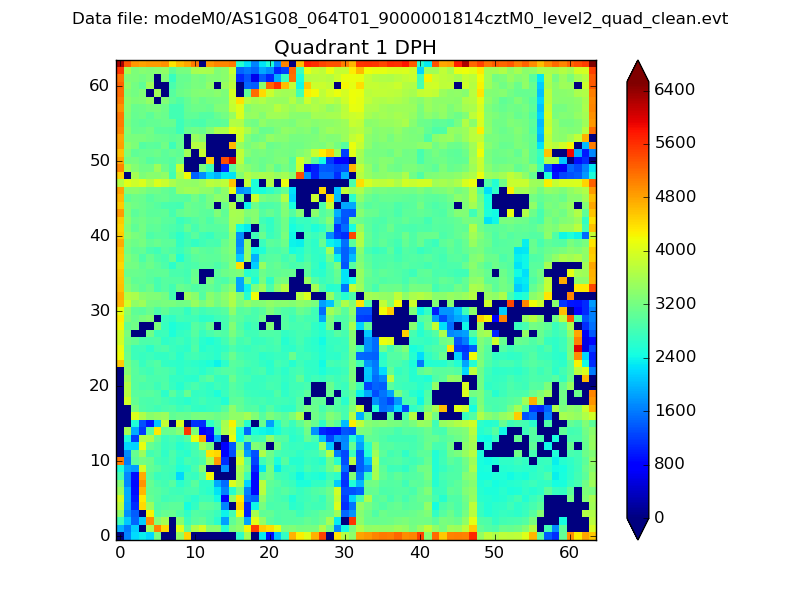
Histogram calculated using DETX and DETY for each event in the final _common_clean file
| Quadrant A |  |
 |
Quadrant B |
|---|---|---|---|
| Quadrant D |  |
 |
Quadrant C |
| Plot type | Count rate plots | Images |
|---|---|---|
| Comparison with Poisson distribution Blue bars denote a histogram of data divided into 1 sec bins. Red curve is a Poisson curve with rate = median count rate of data. |
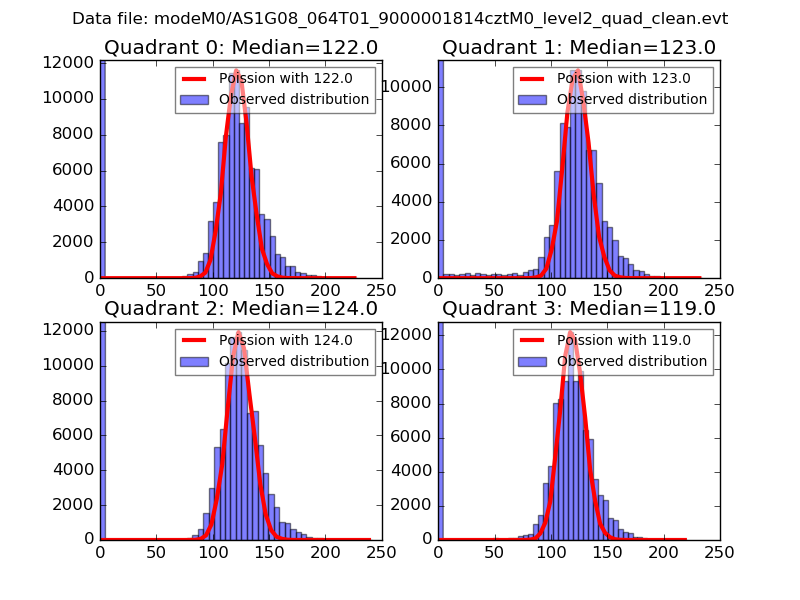 |
 |
| Quadrant-wise count rates Data is divided into 100 sec bins |
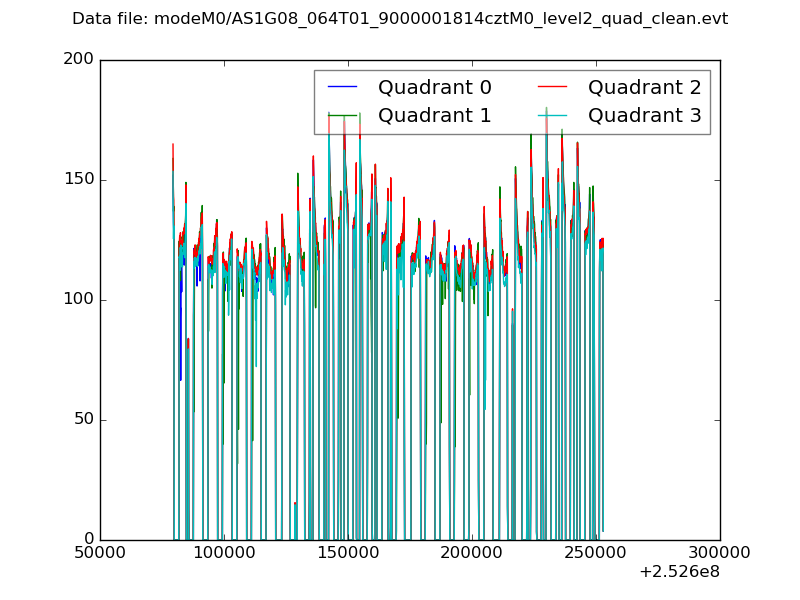 |
|
| Module-wise count rates for Quadrant A Data is divided into 100 sec bins |
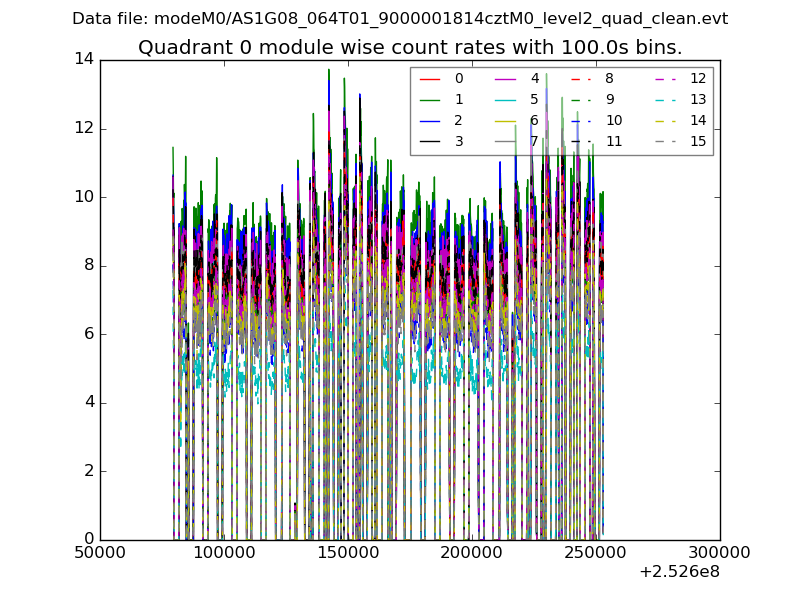 |
 |
| Module-wise count rates for Quadrant B Data is divided into 100 sec bins |
 |
 |
| Module-wise count rates for Quadrant C Data is divided into 100 sec bins |
 |
 |
| Module-wise count rates for Quadrant D Data is divided into 100 sec bins |
 |
 |
| Parameter | Plot |
|---|---|
| CZT HV Monitor |  |
| D_VDD | 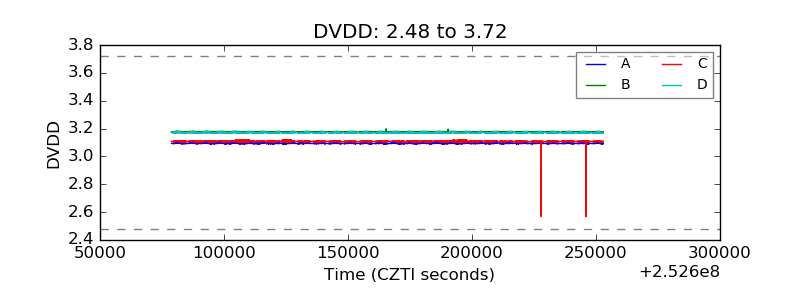 |
| Temperature 1 |  |
| Veto HV Monitor |  |
| Veto LLD |  |
| Alpha Counter |  |
| _CPM_Rate |  |
| CZT Counter |  |
| +2.5 Volts monitor |  |
| +5 Volts monitor |  |
| _ROLL_ROT |  |
| _Roll_DEC |  |
| _Roll_RA |  |
| Veto Counter |  |