| Param | Original file | Final file |
|---|---|---|
| Filename | modeM0/AS1C03_014T03_9000001808cztM0_level2_bc.evt | modeM0/AS1C03_014T03_9000001808cztM0_level2_quad_clean.evt |
| Size (bytes) | 2,290,731,840 | 954,066,240 |
| Size | 2.1 GB | 909.9 MB |
| Events in quadrant A | 17,221,719 | 6,420,897 |
| Events in quadrant B | 20,753,155 | 6,299,866 |
| Events in quadrant C | 11,499,071 | 6,449,451 |
| Events in quadrant D | 16,347,594 | 6,149,481 |
| Mode M9 | |||
|---|---|---|---|
| Quadrant | BADHDUFLAG | Total packets | Discarded packets |
| A | 0 | 61 | 0 |
| B | 0 | 61 | 0 |
| C | 0 | 61 | 0 |
| D | 0 | 61 | 0 |
| Mode SS | |||
|---|---|---|---|
| Quadrant | BADHDUFLAG | Total packets | Discarded packets |
| A | 0 | 1062 | 0 |
| B | 0 | 1062 | 0 |
| C | 0 | 1062 | 0 |
| D | 0 | 1062 | 0 |
| Mode M0 | |||
|---|---|---|---|
| Quadrant | BADHDUFLAG | Total packets | Discarded packets |
| A | 0 | 136803 | 0 |
| B | 0 | 147400 | 0 |
| C | 0 | 110956 | 0 |
| D | 0 | 126589 | 0 |
| Quadrant | Total seconds | Saturated seconds | Saturation percentage |
|---|---|---|---|
| A | 52163 | 1574 | 3.017464% |
| B | 52163 | 4138 | 7.932826% |
| C | 52163 | 501 | 0.960451% |
| D | 52163 | 1707 | 3.272434% |
Noise dominated data is calculated using 1-second bins in cleaned event files. If a bin has >2000 counts, and if more than 50% of those come from <1% of pixels, then it is considered to be noise-dominated and hence unusable.
| Quadrant | # 1 sec bins | Bins with >0 counts | Bins with >2000 counts | High rate bins dominated by noise | Noise dominated (total time) | Noise dominated (detector-on time) | Marked lightcurve |
|---|---|---|---|---|---|---|---|
| A | 58344 | 52163 | 26 | 26 | 0.04% | 0.05% |  |
| B | 58344 | 52148 | 195 | 195 | 0.33% | 0.37% |  |
| C | 58344 | 52165 | 16 | 16 | 0.03% | 0.03% |  |
| D | 58344 | 52163 | 429 | 429 | 0.74% | 0.82% |  |
Top three noisy pixels from each quadrant. If the there are fewer than three noisy pixels in the level2.evt file, extra rows are filled as -1
| Pixel properties | Quadrant properties | ||||||
|---|---|---|---|---|---|---|---|
| Quadrant | DetID | PixID | Counts | Sigma | Mean | Median | Sigma |
| A | 13 | 251 | 5102156 | 8877.25 | 2598 | 2553 | 574.5 |
| A | 8 | 15 | 670169 | 1162.17 | 2598 | 2553 | 574.5 |
| A | 1 | 162 | 634567 | 1100.19 | 2598 | 2553 | 574.5 |
| B | 4 | 206 | 5812231 | 11960.18 | 2548 | 2488 | 485.8 |
| B | 4 | 239 | 2595519 | 5338.12 | 2548 | 2488 | 485.8 |
| B | 3 | 64 | 901840 | 1851.44 | 2548 | 2488 | 485.8 |
| C | 15 | 208 | 1192546 | 2098.84 | 2557 | 2528 | 567.0 |
| C | 4 | 175 | 151281 | 262.36 | 2557 | 2528 | 567.0 |
| C | 5 | 112 | 52077 | 87.39 | 2557 | 2528 | 567.0 |
| D | 1 | 52 | 2149551 | 3541.72 | 2557 | 2465 | 606.2 |
| D | 10 | 199 | 2118012 | 3489.7 | 2557 | 2465 | 606.2 |
| D | 13 | 249 | 406943 | 667.21 | 2557 | 2465 | 606.2 |
Histogram calculated using DETX and DETY for each event in the final _common_clean file
| Quadrant A | 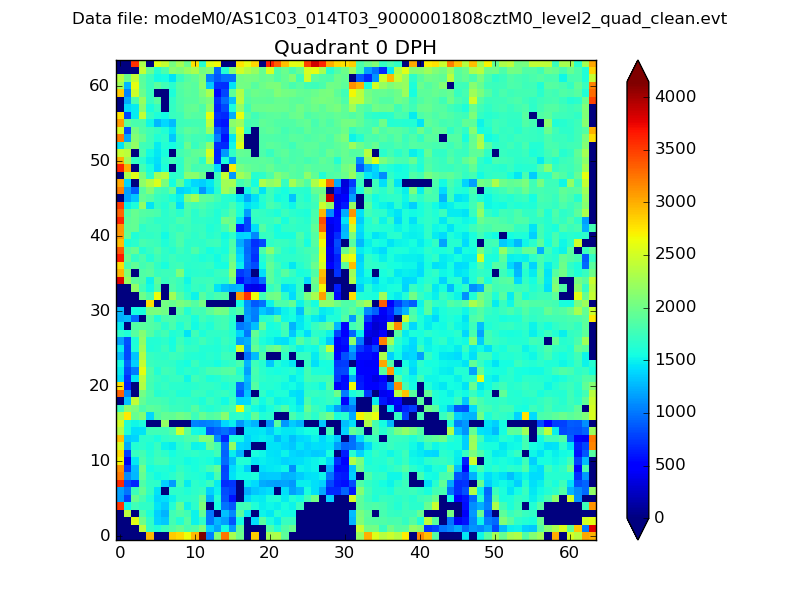 |
 |
Quadrant B |
|---|---|---|---|
| Quadrant D |  |
 |
Quadrant C |
| Plot type | Count rate plots | Images |
|---|---|---|
| Comparison with Poisson distribution Blue bars denote a histogram of data divided into 1 sec bins. Red curve is a Poisson curve with rate = median count rate of data. |
 |
 |
| Quadrant-wise count rates Data is divided into 100 sec bins |
 |
|
| Module-wise count rates for Quadrant A Data is divided into 100 sec bins |
 |
 |
| Module-wise count rates for Quadrant B Data is divided into 100 sec bins |
 |
 |
| Module-wise count rates for Quadrant C Data is divided into 100 sec bins |
 |
 |
| Module-wise count rates for Quadrant D Data is divided into 100 sec bins |
 |
 |
| Parameter | Plot |
|---|---|
| CZT HV Monitor | 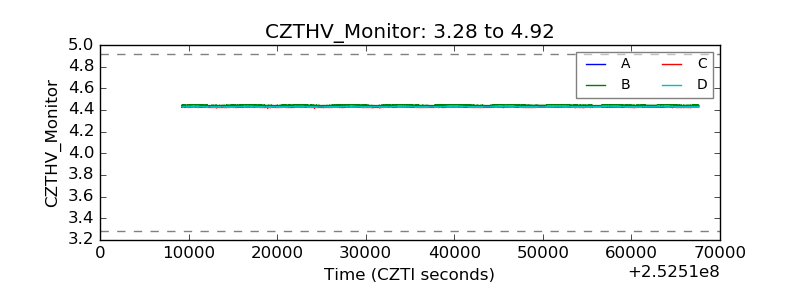 |
| D_VDD |  |
| Temperature 1 | 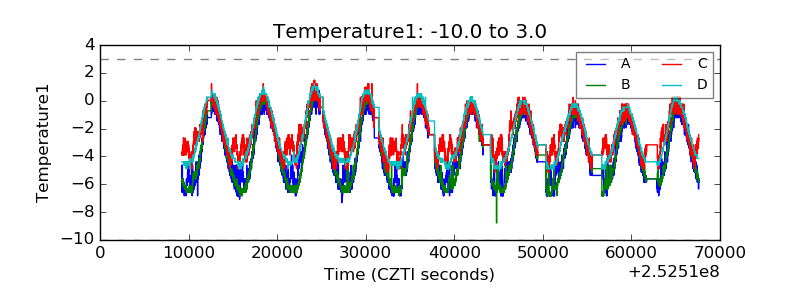 |
| Veto HV Monitor |  |
| Veto LLD |  |
| Alpha Counter |  |
| _CPM_Rate |  |
| CZT Counter |  |
| +2.5 Volts monitor |  |
| +5 Volts monitor |  |
| _ROLL_ROT |  |
| _Roll_DEC | 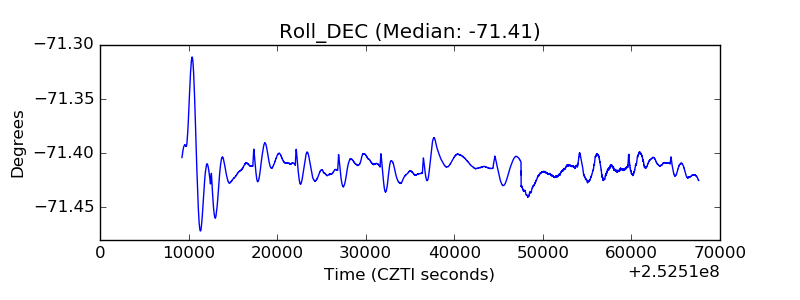 |
| _Roll_RA | 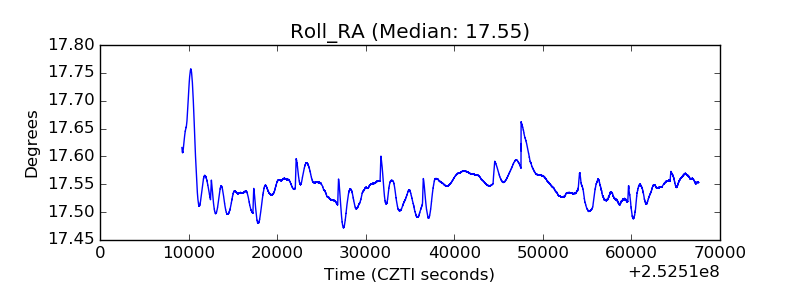 |
| Veto Counter |  |