| Param | Original file | Final file |
|---|---|---|
| Filename | modeM0/AS1A04_066T01_9000001802cztM0_level2_bc.evt | modeM0/AS1A04_066T01_9000001802cztM0_level2_quad_clean.evt |
| Size (bytes) | 3,846,844,800 | 1,509,364,800 |
| Size | 3.6 GB | 1.4 GB |
| Events in quadrant A | 29,716,897 | 10,293,862 |
| Events in quadrant B | 37,268,316 | 9,711,836 |
| Events in quadrant C | 18,048,912 | 10,321,140 |
| Events in quadrant D | 25,948,789 | 9,830,443 |
| Mode M0 | |||
|---|---|---|---|
| Quadrant | BADHDUFLAG | Total packets | Discarded packets |
| A | 0 | 230117 | 0 |
| B | 0 | 264475 | 0 |
| C | 0 | 171740 | 0 |
| D | 0 | 200854 | 0 |
| Mode SS | |||
|---|---|---|---|
| Quadrant | BADHDUFLAG | Total packets | Discarded packets |
| A | 0 | 1651 | 0 |
| B | 0 | 1652 | 0 |
| C | 0 | 1650 | 0 |
| D | 0 | 1646 | 0 |
| Mode M9 | |||
|---|---|---|---|
| Quadrant | BADHDUFLAG | Total packets | Discarded packets |
| A | 0 | 129 | 0 |
| B | 0 | 129 | 0 |
| C | 0 | 129 | 0 |
| D | 0 | 129 | 0 |
| Quadrant | Total seconds | Saturated seconds | Saturation percentage |
|---|---|---|---|
| A | 81072 | 3283 | 4.049487% |
| B | 81014 | 10877 | 13.426075% |
| C | 81142 | 796 | 0.980996% |
| D | 81149 | 2705 | 3.333374% |
Noise dominated data is calculated using 1-second bins in cleaned event files. If a bin has >2000 counts, and if more than 50% of those come from <1% of pixels, then it is considered to be noise-dominated and hence unusable.
| Quadrant | # 1 sec bins | Bins with >0 counts | Bins with >2000 counts | High rate bins dominated by noise | Noise dominated (total time) | Noise dominated (detector-on time) | Marked lightcurve |
|---|---|---|---|---|---|---|---|
| A | 102419 | 81246 | 50 | 50 | 0.05% | 0.06% |  |
| B | 102419 | 81105 | 449 | 449 | 0.44% | 0.55% |  |
| C | 102420 | 81312 | 87 | 87 | 0.08% | 0.11% |  |
| D | 102419 | 81308 | 365 | 365 | 0.36% | 0.45% |  |
Top three noisy pixels from each quadrant. If the there are fewer than three noisy pixels in the level2.evt file, extra rows are filled as -1
| Pixel properties | Quadrant properties | ||||||
|---|---|---|---|---|---|---|---|
| Quadrant | DetID | PixID | Counts | Sigma | Mean | Median | Sigma |
| A | 13 | 251 | 9765999 | 10843.51 | 4168 | 4108 | 900.3 |
| A | 8 | 15 | 1716297 | 1901.9 | 4168 | 4108 | 900.3 |
| A | 1 | 162 | 1144369 | 1266.6 | 4168 | 4108 | 900.3 |
| B | 4 | 239 | 11372895 | 15168.98 | 3945 | 3853 | 749.5 |
| B | 15 | 204 | 2928849 | 3902.63 | 3945 | 3853 | 749.5 |
| B | 4 | 206 | 2130649 | 2837.65 | 3945 | 3853 | 749.5 |
| C | 15 | 208 | 1150854 | 1275.66 | 4087 | 4051 | 899.0 |
| C | 5 | 112 | 478853 | 528.15 | 4087 | 4051 | 899.0 |
| C | 4 | 175 | 184578 | 200.81 | 4087 | 4051 | 899.0 |
| D | 1 | 52 | 2746115 | 2875.11 | 4099 | 3964 | 953.8 |
| D | 13 | 104 | 1512035 | 1581.19 | 4099 | 3964 | 953.8 |
| D | 2 | 33 | 1193520 | 1247.23 | 4099 | 3964 | 953.8 |
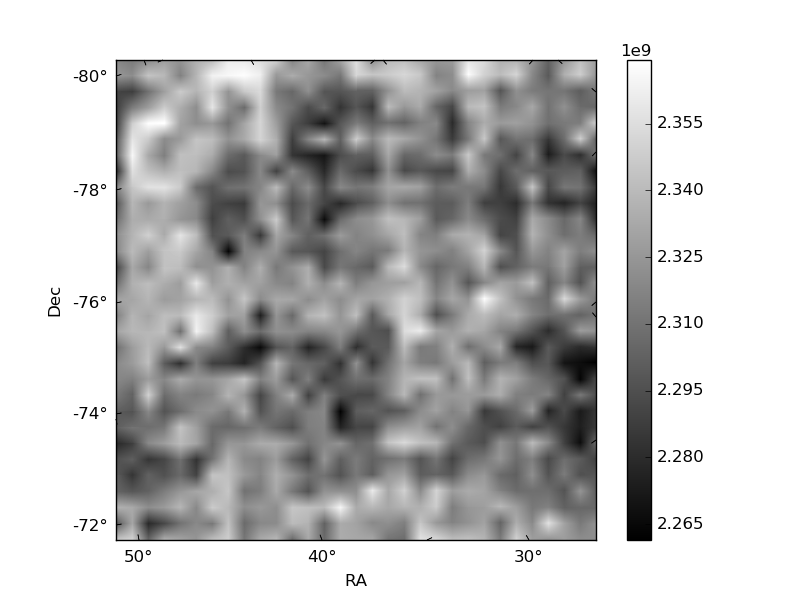
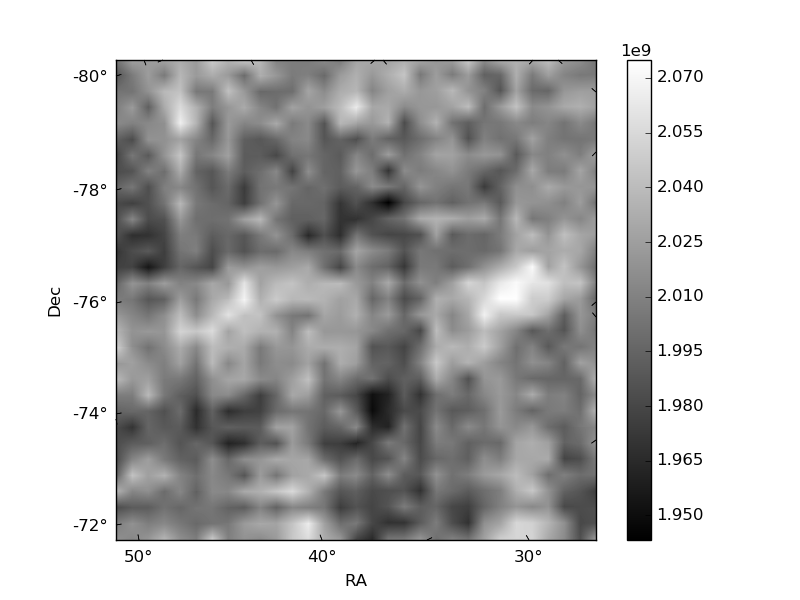
Histogram calculated using DETX and DETY for each event in the final _common_clean file
| Quadrant A |  |
 |
Quadrant B |
|---|---|---|---|
| Quadrant D |  |
 |
Quadrant C |
| Plot type | Count rate plots | Images |
|---|---|---|
| Comparison with Poisson distribution Blue bars denote a histogram of data divided into 1 sec bins. Red curve is a Poisson curve with rate = median count rate of data. |
 |
 |
| Quadrant-wise count rates Data is divided into 100 sec bins |
 |
|
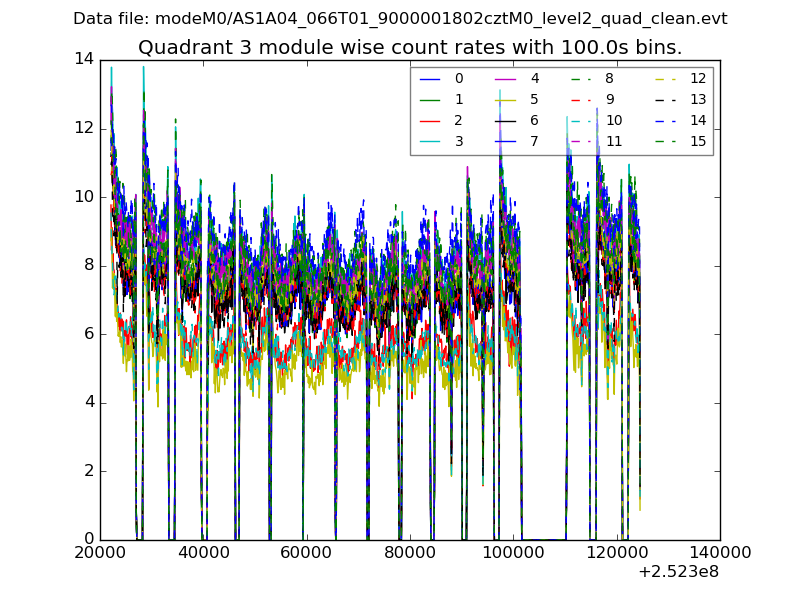
| Module-wise count rates for Quadrant A Data is divided into 100 sec bins |
 |
 |
| Module-wise count rates for Quadrant B Data is divided into 100 sec bins |
 |
 |
| Module-wise count rates for Quadrant C Data is divided into 100 sec bins |
 |
 |
| Module-wise count rates for Quadrant D Data is divided into 100 sec bins |
 |
 |
| Parameter | Plot |
|---|---|
| CZT HV Monitor | 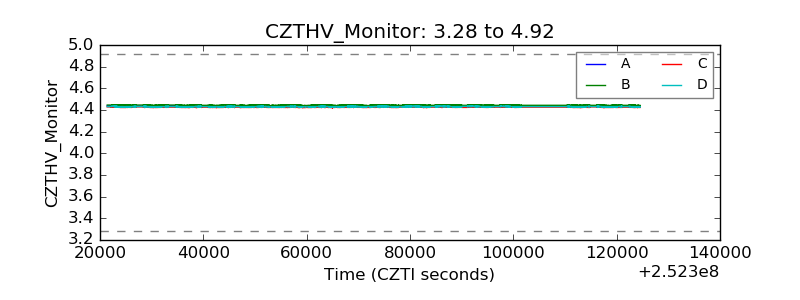 |
| D_VDD |  |
| Temperature 1 |  |
| Veto HV Monitor |  |
| Veto LLD |  |
| Alpha Counter |  |
| _CPM_Rate |  |
| CZT Counter |  |
| +2.5 Volts monitor |  |
| +5 Volts monitor |  |
| _ROLL_ROT | 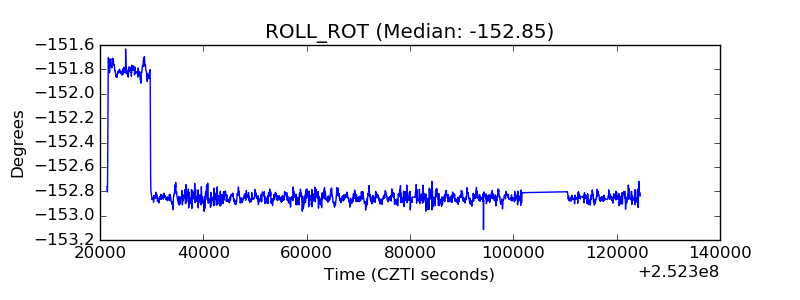 |
| _Roll_DEC |  |
| _Roll_RA |  |
| Veto Counter |  |