| Param | Original file | Final file |
|---|---|---|
| Filename | modeM0/AS1G08_010T03_9000001800cztM0_level2_bc.evt | modeM0/AS1G08_010T03_9000001800cztM0_level2_quad_clean.evt |
| Size (bytes) | 1,569,844,800 | 500,535,360 |
| Size | 1.5 GB | 477.3 MB |
| Events in quadrant A | 9,202,868 | 3,168,975 |
| Events in quadrant B | 13,220,440 | 3,107,875 |
| Events in quadrant C | 8,327,429 | 3,131,719 |
| Events in quadrant D | 14,034,569 | 2,976,200 |
| Mode M0 | |||
|---|---|---|---|
| Quadrant | BADHDUFLAG | Total packets | Discarded packets |
| A | 0 | 90974 | 0 |
| B | 0 | 106792 | 0 |
| C | 0 | 84134 | 0 |
| D | 0 | 104739 | 0 |
| Mode SS | |||
|---|---|---|---|
| Quadrant | BADHDUFLAG | Total packets | Discarded packets |
| A | 0 | 828 | 0 |
| B | 0 | 828 | 0 |
| C | 0 | 828 | 0 |
| D | 0 | 828 | 0 |
| Mode M9 | |||
|---|---|---|---|
| Quadrant | BADHDUFLAG | Total packets | Discarded packets |
| A | 0 | 46 | 0 |
| B | 0 | 46 | 0 |
| C | 0 | 46 | 0 |
| D | 0 | 46 | 0 |
| Quadrant | Total seconds | Saturated seconds | Saturation percentage |
|---|---|---|---|
| A | 40394 | 597 | 1.477942% |
| B | 40394 | 2669 | 6.607417% |
| C | 40394 | 261 | 0.646136% |
| D | 40394 | 1646 | 4.074863% |
Noise dominated data is calculated using 1-second bins in cleaned event files. If a bin has >2000 counts, and if more than 50% of those come from <1% of pixels, then it is considered to be noise-dominated and hence unusable.
| Quadrant | # 1 sec bins | Bins with >0 counts | Bins with >2000 counts | High rate bins dominated by noise | Noise dominated (total time) | Noise dominated (detector-on time) | Marked lightcurve |
|---|---|---|---|---|---|---|---|
| A | 45275 | 40395 | 3 | 3 | 0.01% | 0.01% |  |
| B | 45275 | 40385 | 73 | 73 | 0.16% | 0.18% |  |
| C | 45275 | 40396 | 10 | 10 | 0.02% | 0.02% |  |
| D | 45275 | 40391 | 318 | 318 | 0.70% | 0.79% |  |
Top three noisy pixels from each quadrant. If the there are fewer than three noisy pixels in the level2.evt file, extra rows are filled as -1
| Pixel properties | Quadrant properties | ||||||
|---|---|---|---|---|---|---|---|
| Quadrant | DetID | PixID | Counts | Sigma | Mean | Median | Sigma |
| A | 1 | 162 | 469831 | 1071.07 | 2016 | 1975 | 436.8 |
| A | 8 | 15 | 282003 | 641.07 | 2016 | 1975 | 436.8 |
| A | 13 | 251 | 249819 | 567.39 | 2016 | 1975 | 436.8 |
| B | 4 | 239 | 4036778 | 10684.21 | 1957 | 1902 | 377.6 |
| B | 15 | 204 | 775682 | 2048.94 | 1957 | 1902 | 377.6 |
| B | 11 | 51 | 303624 | 798.95 | 1957 | 1902 | 377.6 |
| C | 15 | 208 | 435879 | 1005.37 | 1954 | 1925 | 431.6 |
| C | 5 | 112 | 131010 | 299.06 | 1954 | 1925 | 431.6 |
| C | 4 | 175 | 28094 | 60.63 | 1954 | 1925 | 431.6 |
| D | 1 | 52 | 3471974 | 7673.75 | 1948 | 1883 | 452.2 |
| D | 10 | 157 | 653992 | 1442.07 | 1948 | 1883 | 452.2 |
| D | 4 | 95 | 477266 | 1051.26 | 1948 | 1883 | 452.2 |
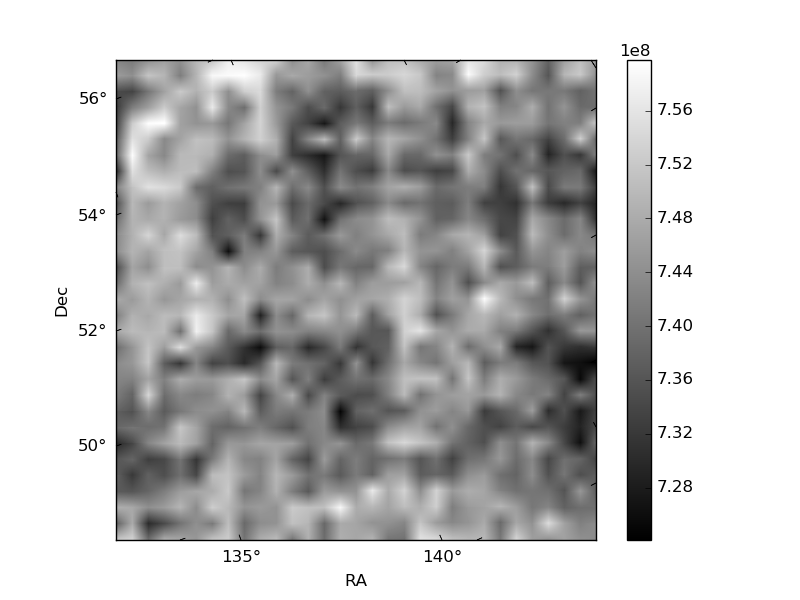
Histogram calculated using DETX and DETY for each event in the final _common_clean file
| Quadrant A |  |
 |
Quadrant B |
|---|---|---|---|
| Quadrant D |  |
 |
Quadrant C |
| Plot type | Count rate plots | Images |
|---|---|---|
| Comparison with Poisson distribution Blue bars denote a histogram of data divided into 1 sec bins. Red curve is a Poisson curve with rate = median count rate of data. |
 |
 |
| Quadrant-wise count rates Data is divided into 100 sec bins |
 |
|
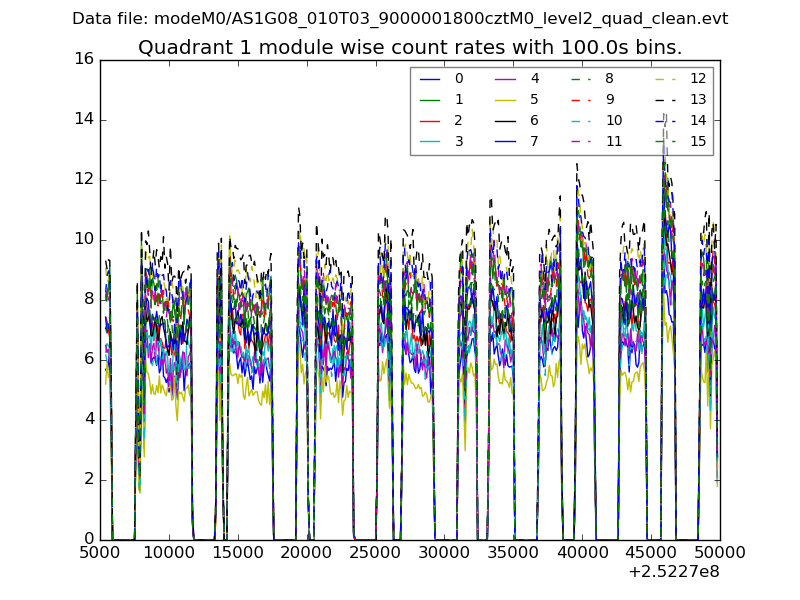
| Module-wise count rates for Quadrant A Data is divided into 100 sec bins |
 |
 |
| Module-wise count rates for Quadrant B Data is divided into 100 sec bins |
 |
 |
| Module-wise count rates for Quadrant C Data is divided into 100 sec bins |
 |
 |
| Module-wise count rates for Quadrant D Data is divided into 100 sec bins |
 |
 |
| Parameter | Plot |
|---|---|
| CZT HV Monitor |  |
| D_VDD |  |
| Temperature 1 |  |
| Veto HV Monitor |  |
| Veto LLD | 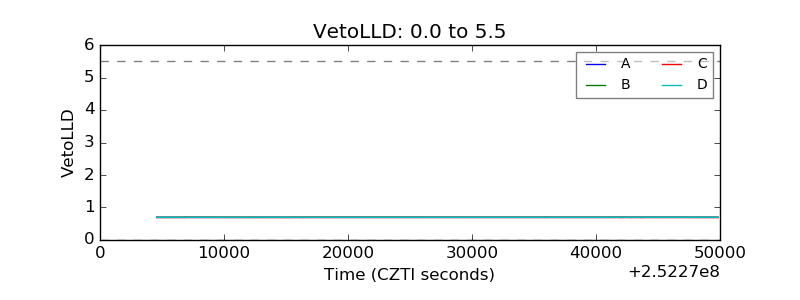 |
| Alpha Counter |  |
| _CPM_Rate |  |
| CZT Counter |  |
| +2.5 Volts monitor |  |
| +5 Volts monitor |  |
| _ROLL_ROT |  |
| _Roll_DEC |  |
| _Roll_RA |  |
| Veto Counter |  |