| Param | Original file | Final file |
|---|---|---|
| Filename | modeM0/AS1G08_065T01_9000001796cztM0_level2_bc.evt | modeM0/AS1G08_065T01_9000001796cztM0_level2_quad_clean.evt |
| Size (bytes) | 19,238,186,880 | 6,328,272,960 |
| Size | 17.9 GB | 5.9 GB |
| Events in quadrant A | 131,254,913 | 40,707,011 |
| Events in quadrant B | 167,818,326 | 39,715,344 |
| Events in quadrant C | 97,017,995 | 40,611,198 |
| Events in quadrant D | 155,114,006 | 39,000,867 |
| Mode M0 | |||
|---|---|---|---|
| Quadrant | BADHDUFLAG | Total packets | Discarded packets |
| A | 0 | 1102453 | 0 |
| B | 0 | 1273157 | 0 |
| C | 0 | 966840 | 0 |
| D | 0 | 1149224 | 0 |
| Mode M9 | |||
|---|---|---|---|
| Quadrant | BADHDUFLAG | Total packets | Discarded packets |
| A | 0 | 739 | 0 |
| B | 0 | 739 | 0 |
| C | 0 | 739 | 0 |
| D | 0 | 739 | 0 |
| Mode SS | |||
|---|---|---|---|
| Quadrant | BADHDUFLAG | Total packets | Discarded packets |
| A | 0 | 9410 | 0 |
| B | 0 | 9410 | 0 |
| C | 0 | 9410 | 0 |
| D | 0 | 9410 | 0 |
| Quadrant | Total seconds | Saturated seconds | Saturation percentage |
|---|---|---|---|
| A | 462155 | 15471 | 3.347578% |
| B | 462149 | 30840 | 6.673173% |
| C | 462153 | 4271 | 0.924153% |
| D | 462148 | 13783 | 2.982378% |
Noise dominated data is calculated using 1-second bins in cleaned event files. If a bin has >2000 counts, and if more than 50% of those come from <1% of pixels, then it is considered to be noise-dominated and hence unusable.
| Quadrant | # 1 sec bins | Bins with >0 counts | Bins with >2000 counts | High rate bins dominated by noise | Noise dominated (total time) | Noise dominated (detector-on time) | Marked lightcurve |
|---|---|---|---|---|---|---|---|
| A | 535809 | 462143 | 3379 | 3379 | 0.63% | 0.73% |  |
| B | 535809 | 462116 | 1280 | 1280 | 0.24% | 0.28% |  |
| C | 535809 | 462163 | 147 | 147 | 0.03% | 0.03% |  |
| D | 535809 | 462142 | 2693 | 2693 | 0.50% | 0.58% |  |
Top three noisy pixels from each quadrant. If the there are fewer than three noisy pixels in the level2.evt file, extra rows are filled as -1
| Pixel properties | Quadrant properties | ||||||
|---|---|---|---|---|---|---|---|
| Quadrant | DetID | PixID | Counts | Sigma | Mean | Median | Sigma |
| A | 14 | 63 | 25401116 | 4899.42 | 24017 | 23598 | 5179.7 |
| A | 1 | 162 | 3654572 | 701.0 | 24017 | 23598 | 5179.7 |
| A | 13 | 248 | 3227360 | 618.52 | 24017 | 23598 | 5179.7 |
| B | 4 | 239 | 43134753 | 9750.8 | 23492 | 22891 | 4421.4 |
| B | 0 | 85 | 6257091 | 1410.02 | 23492 | 22891 | 4421.4 |
| B | 15 | 204 | 5418013 | 1220.24 | 23492 | 22891 | 4421.4 |
| C | 15 | 208 | 4134369 | 803.05 | 23509 | 23222 | 5119.4 |
| C | 14 | 234 | 347035 | 63.25 | 23509 | 23222 | 5119.4 |
| C | 3 | 233 | 234209 | 41.21 | 23509 | 23222 | 5119.4 |
| D | 1 | 52 | 28221225 | 5201.75 | 23603 | 22841 | 5420.9 |
| D | 8 | 195 | 12131666 | 2233.71 | 23603 | 22841 | 5420.9 |
| D | 14 | 34 | 5115302 | 939.41 | 23603 | 22841 | 5420.9 |
Histogram calculated using DETX and DETY for each event in the final _common_clean file
| Quadrant A | 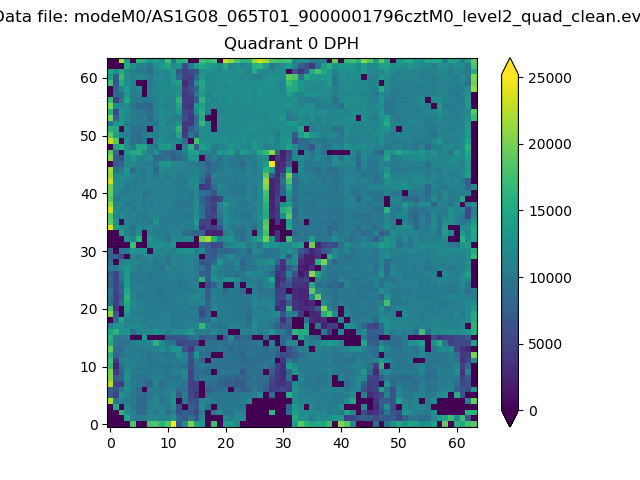 |
 |
Quadrant B |
|---|---|---|---|
| Quadrant D | 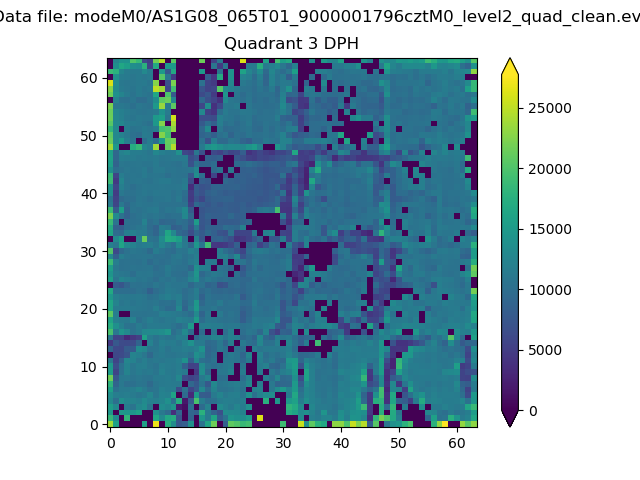 |
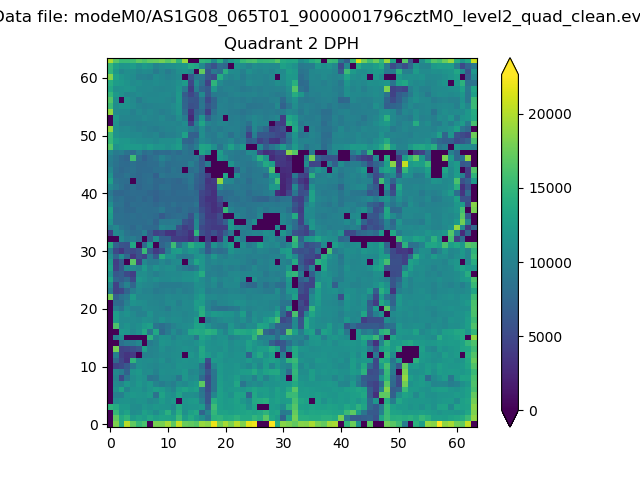 |
Quadrant C |
| Plot type | Count rate plots | Images |
|---|---|---|
| Comparison with Poisson distribution Blue bars denote a histogram of data divided into 1 sec bins. Red curve is a Poisson curve with rate = median count rate of data. |
 |
 |
| Quadrant-wise count rates Data is divided into 100 sec bins |
 |
|
| Module-wise count rates for Quadrant A Data is divided into 100 sec bins |
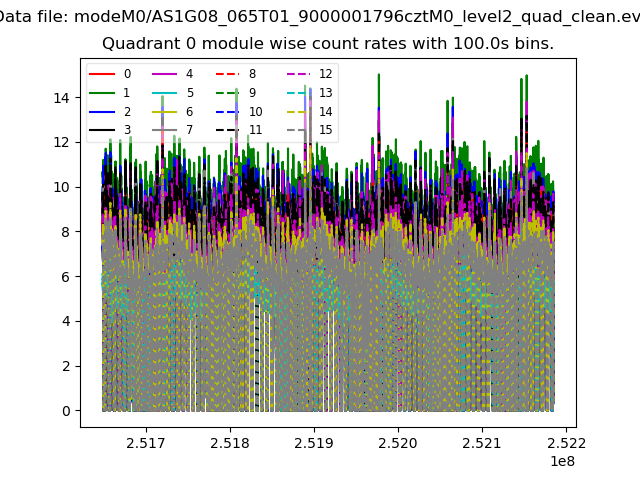 |
 |
| Module-wise count rates for Quadrant B Data is divided into 100 sec bins |
 |
 |
| Module-wise count rates for Quadrant C Data is divided into 100 sec bins |
 |
 |
| Module-wise count rates for Quadrant D Data is divided into 100 sec bins |
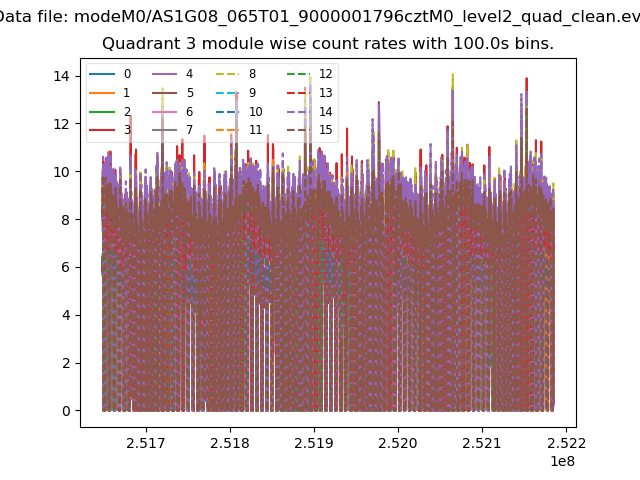 |
 |
| Parameter | Plot |
|---|---|
| CZT HV Monitor |  |
| D_VDD |  |
| Temperature 1 |  |
| Veto HV Monitor |  |
| Veto LLD | 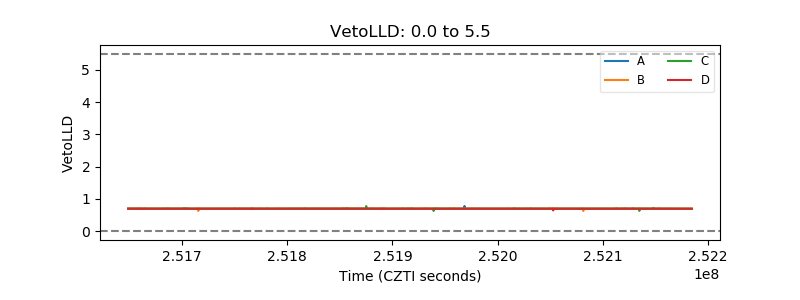 |
| Alpha Counter |  |
| _CPM_Rate |  |
| CZT Counter |  |
| +2.5 Volts monitor |  |
| +5 Volts monitor |  |
| _ROLL_ROT | 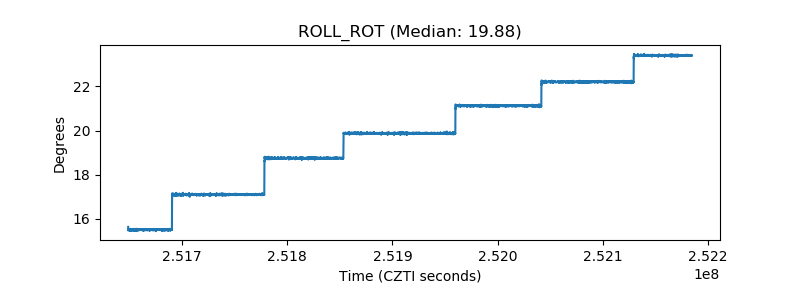 |
| _Roll_DEC |  |
| _Roll_RA |  |
| Veto Counter |  |