| Param | Original file | Final file |
|---|---|---|
| Filename | modeM0/AS1A04_130T04_9000001794cztM0_level2_bc.evt | modeM0/AS1A04_130T04_9000001794cztM0_level2_quad_clean.evt |
| Size (bytes) | 869,408,640 | 221,451,840 |
| Size | 829.1 MB | 211.2 MB |
| Events in quadrant A | 6,076,982 | 1,341,932 |
| Events in quadrant B | 8,117,172 | 1,349,244 |
| Events in quadrant C | 3,951,308 | 1,395,781 |
| Events in quadrant D | 6,892,566 | 1,318,049 |
| Mode M9 | |||
|---|---|---|---|
| Quadrant | BADHDUFLAG | Total packets | Discarded packets |
| A | 0 | 36 | 0 |
| B | 0 | 36 | 0 |
| C | 0 | 36 | 0 |
| D | 0 | 36 | 0 |
| Mode SS | |||
|---|---|---|---|
| Quadrant | BADHDUFLAG | Total packets | Discarded packets |
| A | 0 | 384 | 0 |
| B | 0 | 384 | 0 |
| C | 0 | 384 | 0 |
| D | 0 | 384 | 0 |
| Mode M0 | |||
|---|---|---|---|
| Quadrant | BADHDUFLAG | Total packets | Discarded packets |
| A | 0 | 50645 | 0 |
| B | 0 | 58434 | 0 |
| C | 0 | 39019 | 0 |
| D | 0 | 50425 | 0 |
| Quadrant | Total seconds | Saturated seconds | Saturation percentage |
|---|---|---|---|
| A | 18878 | 1439 | 7.622630% |
| B | 18878 | 2016 | 10.679097% |
| C | 18878 | 173 | 0.916411% |
| D | 18878 | 716 | 3.792775% |
Noise dominated data is calculated using 1-second bins in cleaned event files. If a bin has >2000 counts, and if more than 50% of those come from <1% of pixels, then it is considered to be noise-dominated and hence unusable.
| Quadrant | # 1 sec bins | Bins with >0 counts | Bins with >2000 counts | High rate bins dominated by noise | Noise dominated (total time) | Noise dominated (detector-on time) | Marked lightcurve |
|---|---|---|---|---|---|---|---|
| A | 22293 | 18875 | 34 | 34 | 0.15% | 0.18% |  |
| B | 22293 | 18875 | 18 | 18 | 0.08% | 0.10% | 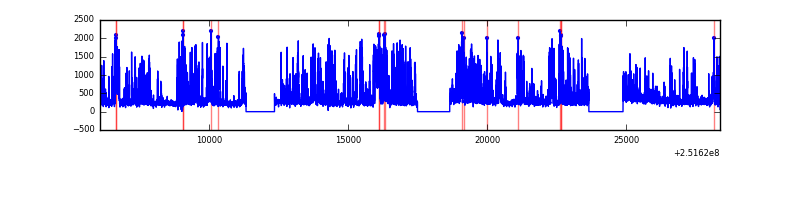 |
| C | 22293 | 18875 | 0 | 0 | 0.00% | 0.00% |  |
| D | 22293 | 18875 | 66 | 66 | 0.30% | 0.35% |  |
Top three noisy pixels from each quadrant. If the there are fewer than three noisy pixels in the level2.evt file, extra rows are filled as -1
| Pixel properties | Quadrant properties | ||||||
|---|---|---|---|---|---|---|---|
| Quadrant | DetID | PixID | Counts | Sigma | Mean | Median | Sigma |
| A | 13 | 248 | 1068714 | 4981.91 | 993 | 977 | 214.3 |
| A | 14 | 63 | 633060 | 2949.21 | 993 | 977 | 214.3 |
| A | 1 | 162 | 198554 | 921.87 | 993 | 977 | 214.3 |
| B | 4 | 239 | 3625499 | 19300.0 | 992 | 970 | 187.8 |
| B | 15 | 204 | 347834 | 1846.99 | 992 | 970 | 187.8 |
| B | 11 | 51 | 186655 | 988.74 | 992 | 970 | 187.8 |
| C | 8 | 208 | 12823 | 54.37 | 1002 | 991 | 217.6 |
| C | 13 | 61 | 6015 | 23.09 | 1002 | 991 | 217.6 |
| C | 12 | 4 | 5482 | 20.64 | 1002 | 991 | 217.6 |
| D | 1 | 52 | 1212837 | 5377.21 | 995 | 960 | 225.4 |
| D | 8 | 195 | 940138 | 4167.22 | 995 | 960 | 225.4 |
| D | 13 | 104 | 169021 | 745.7 | 995 | 960 | 225.4 |
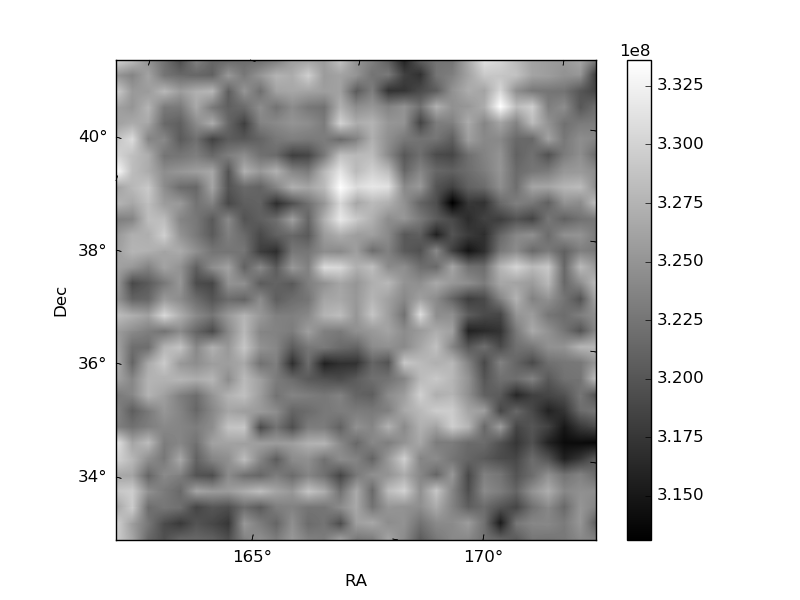
Histogram calculated using DETX and DETY for each event in the final _common_clean file
| Quadrant A |  |
 |
Quadrant B |
|---|---|---|---|
| Quadrant D | 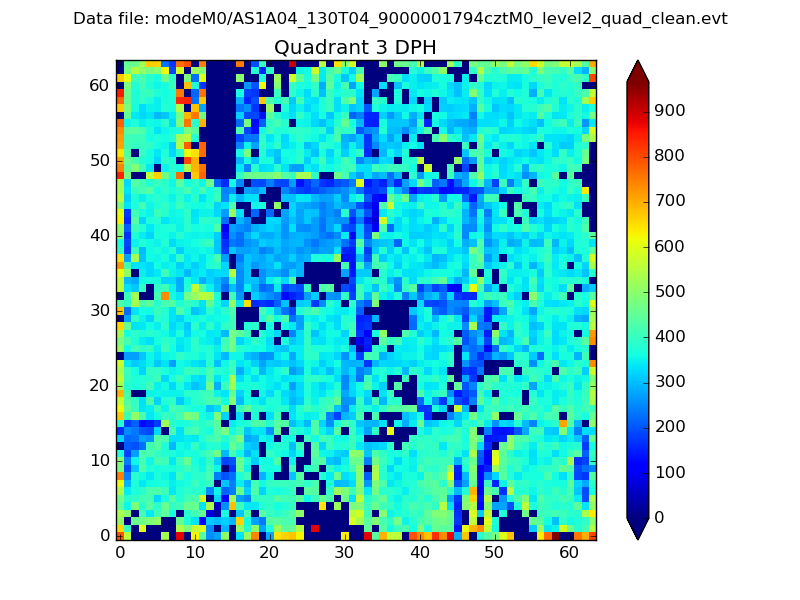 |
 |
Quadrant C |
| Plot type | Count rate plots | Images |
|---|---|---|
| Comparison with Poisson distribution Blue bars denote a histogram of data divided into 1 sec bins. Red curve is a Poisson curve with rate = median count rate of data. |
 |
 |
| Quadrant-wise count rates Data is divided into 100 sec bins |
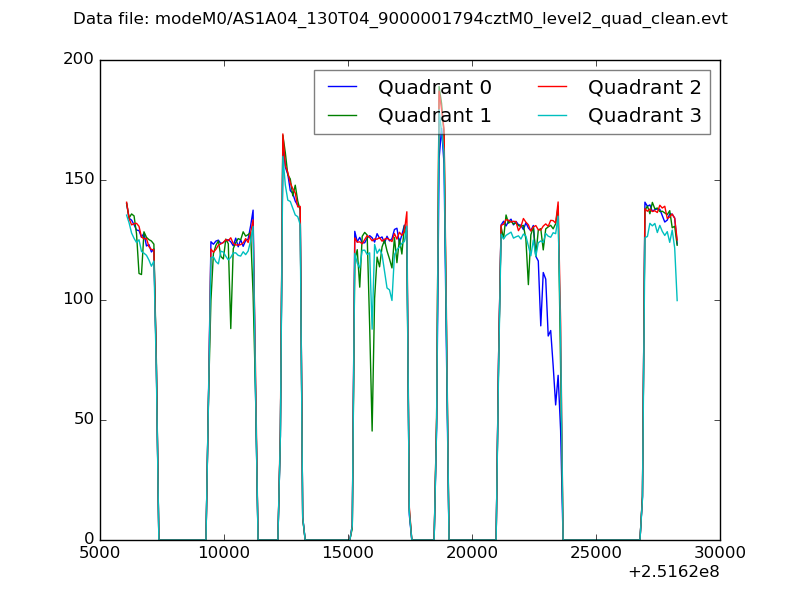 |
|
| Module-wise count rates for Quadrant A Data is divided into 100 sec bins |
 |
 |
| Module-wise count rates for Quadrant B Data is divided into 100 sec bins |
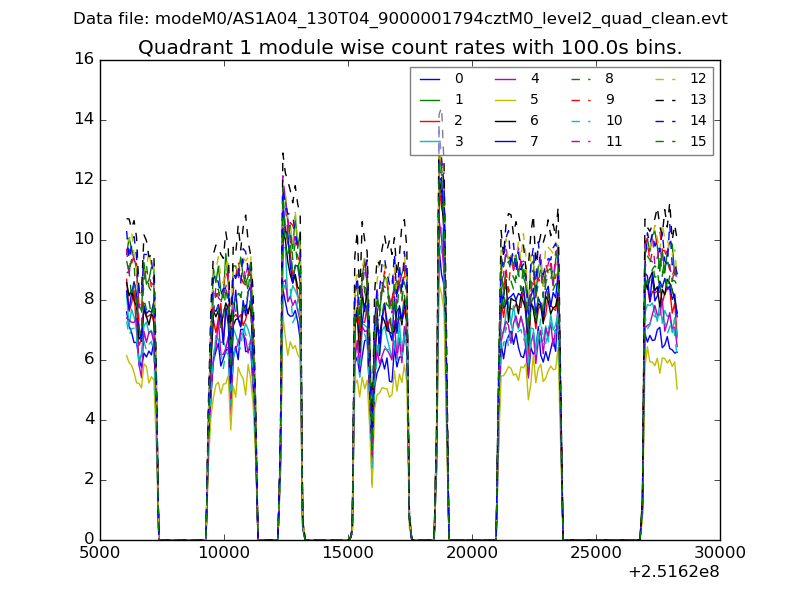 |
 |
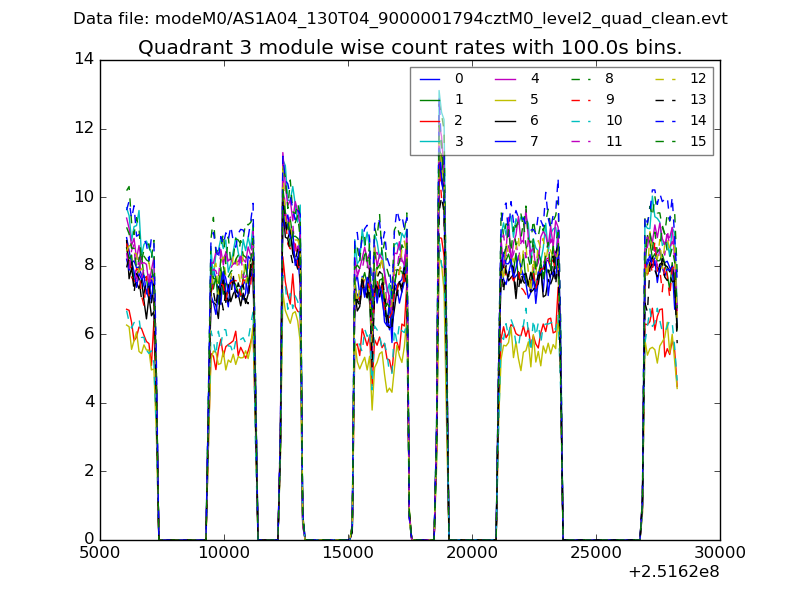
| Module-wise count rates for Quadrant C Data is divided into 100 sec bins |
 |
 |
| Module-wise count rates for Quadrant D Data is divided into 100 sec bins |
 |
 |
| Parameter | Plot |
|---|---|
| CZT HV Monitor |  |
| D_VDD |  |
| Temperature 1 | 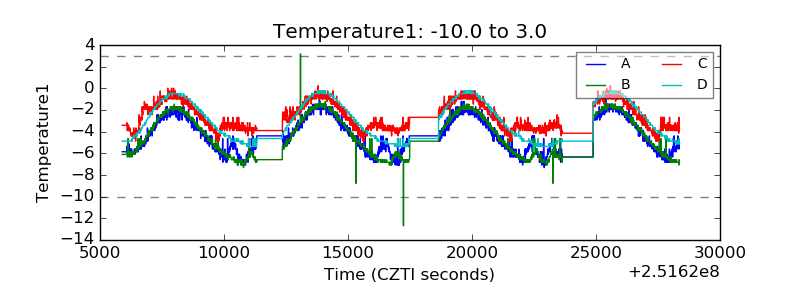 |
| Veto HV Monitor |  |
| Veto LLD |  |
| Alpha Counter |  |
| _CPM_Rate |  |
| CZT Counter |  |
| +2.5 Volts monitor |  |
| +5 Volts monitor |  |
| _ROLL_ROT |  |
| _Roll_DEC |  |
| _Roll_RA |  |
| Veto Counter |  |