| Param | Original file | Final file |
|---|---|---|
| Filename | modeM0/AS1C03_015T01_9000001788cztM0_level2_bc.evt | modeM0/AS1C03_015T01_9000001788cztM0_level2_quad_clean.evt |
| Size (bytes) | 238,187,520 | 133,182,720 |
| Size | 227.2 MB | 127.0 MB |
| Events in quadrant A | 1,553,102 | 903,429 |
| Events in quadrant B | 1,922,388 | 901,450 |
| Events in quadrant C | 1,421,755 | 907,748 |
| Events in quadrant D | 1,864,872 | 867,124 |
| Mode SS | |||
|---|---|---|---|
| Quadrant | BADHDUFLAG | Total packets | Discarded packets |
| A | 0 | 130 | 0 |
| B | 0 | 130 | 0 |
| C | 0 | 130 | 0 |
| D | 0 | 130 | 0 |
| Mode M0 | |||
|---|---|---|---|
| Quadrant | BADHDUFLAG | Total packets | Discarded packets |
| A | 0 | 14099 | 0 |
| B | 0 | 15637 | 0 |
| C | 0 | 13421 | 0 |
| D | 0 | 14665 | 0 |
| Mode M9 | |||
|---|---|---|---|
| Quadrant | BADHDUFLAG | Total packets | Discarded packets |
| A | 0 | 13 | 0 |
| B | 0 | 13 | 0 |
| C | 0 | 13 | 0 |
| D | 0 | 13 | 0 |
| Quadrant | Total seconds | Saturated seconds | Saturation percentage |
|---|---|---|---|
| A | 6521 | 106 | 1.625518% |
| B | 6521 | 237 | 3.634412% |
| C | 6521 | 53 | 0.812759% |
| D | 6521 | 95 | 1.456832% |
Noise dominated data is calculated using 1-second bins in cleaned event files. If a bin has >2000 counts, and if more than 50% of those come from <1% of pixels, then it is considered to be noise-dominated and hence unusable.
| Quadrant | # 1 sec bins | Bins with >0 counts | Bins with >2000 counts | High rate bins dominated by noise | Noise dominated (total time) | Noise dominated (detector-on time) | Marked lightcurve |
|---|---|---|---|---|---|---|---|
| A | 7782 | 6521 | 3 | 3 | 0.04% | 0.05% |  |
| B | 7782 | 6521 | 1 | 1 | 0.01% | 0.02% | 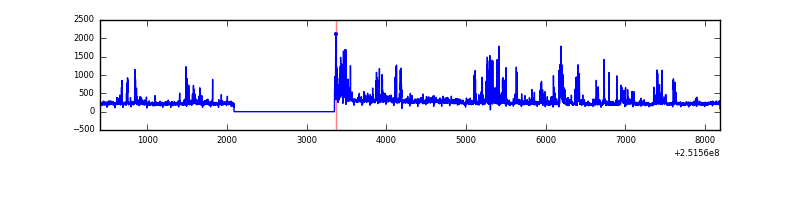 |
| C | 7782 | 6521 | 0 | 0 | 0.00% | 0.00% |  |
| D | 7782 | 6521 | 19 | 19 | 0.24% | 0.29% |  |
Top three noisy pixels from each quadrant. If the there are fewer than three noisy pixels in the level2.evt file, extra rows are filled as -1
| Pixel properties | Quadrant properties | ||||||
|---|---|---|---|---|---|---|---|
| Quadrant | DetID | PixID | Counts | Sigma | Mean | Median | Sigma |
| A | 13 | 251 | 84987 | 1055.4 | 361 | 355 | 80.2 |
| A | 1 | 162 | 21917 | 268.89 | 361 | 355 | 80.2 |
| A | 14 | 63 | 19634 | 240.42 | 361 | 355 | 80.2 |
| B | 4 | 239 | 356465 | 5098.13 | 360 | 352 | 69.9 |
| B | 15 | 204 | 102631 | 1464.23 | 360 | 352 | 69.9 |
| B | 0 | 219 | 21881 | 308.21 | 360 | 352 | 69.9 |
| C | 0 | 207 | 16950 | 203.99 | 359 | 355 | 81.4 |
| C | 13 | 61 | 2169 | 22.3 | 359 | 355 | 81.4 |
| C | 14 | 234 | 1877 | 18.71 | 359 | 355 | 81.4 |
| D | 1 | 52 | 299793 | 3666.83 | 357 | 346 | 81.7 |
| D | 8 | 195 | 81314 | 991.48 | 357 | 346 | 81.7 |
| D | 7 | 71 | 30892 | 374.05 | 357 | 346 | 81.7 |
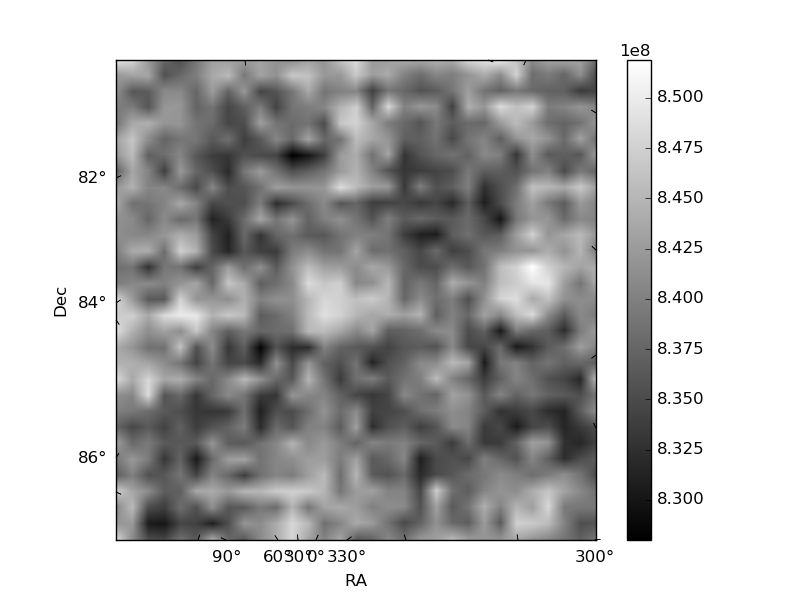
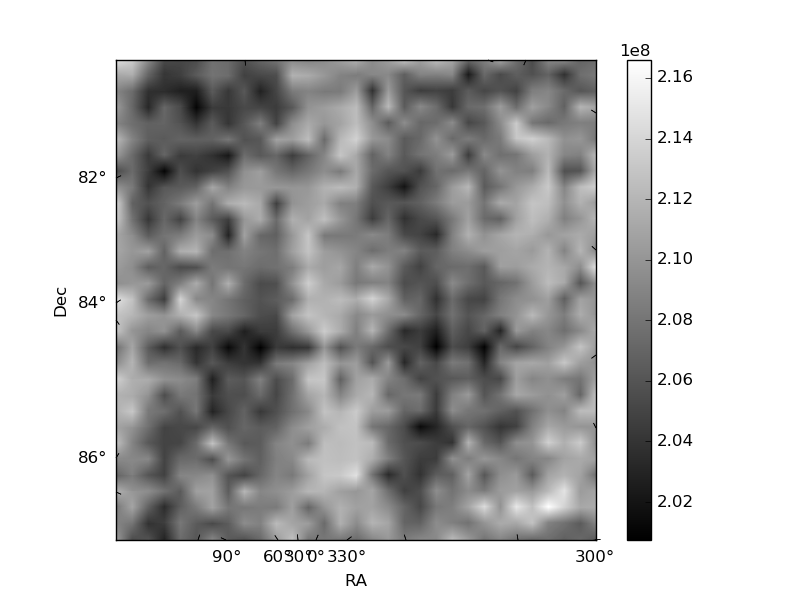
Histogram calculated using DETX and DETY for each event in the final _common_clean file
| Quadrant A | 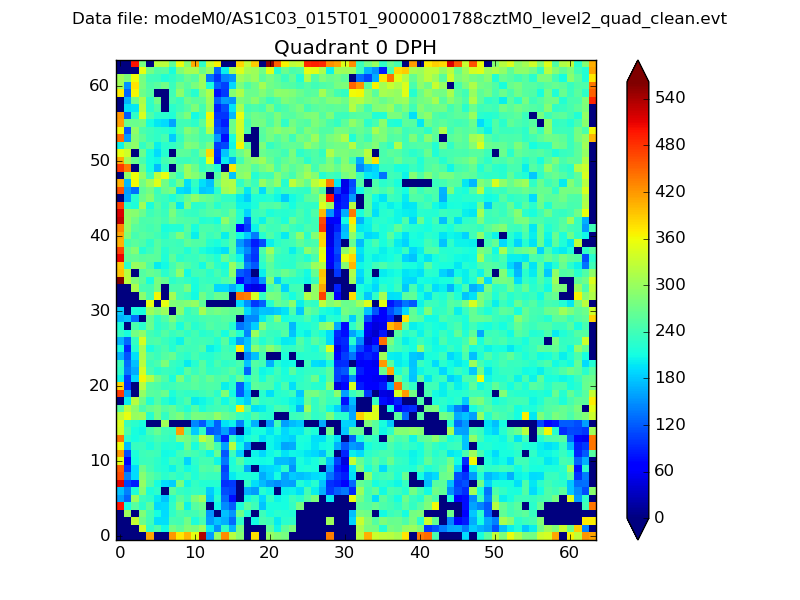 |
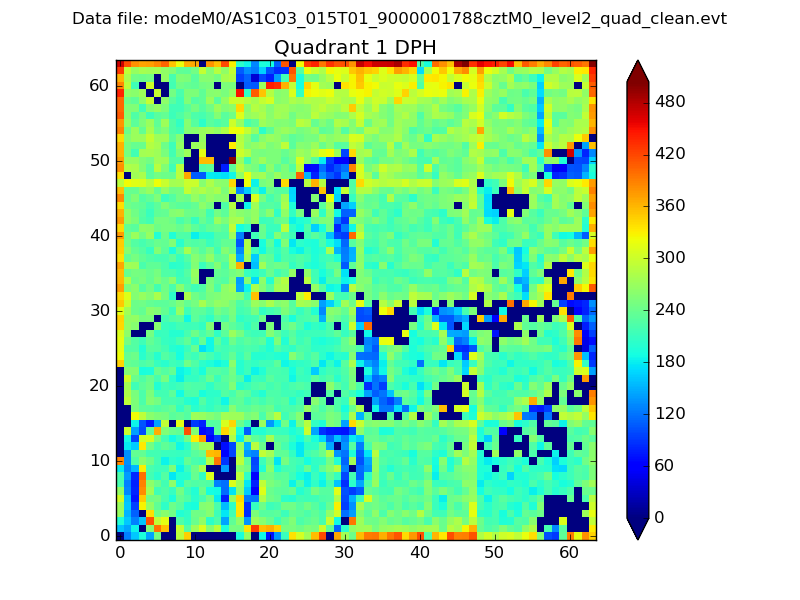 |
Quadrant B |
|---|---|---|---|
| Quadrant D |  |
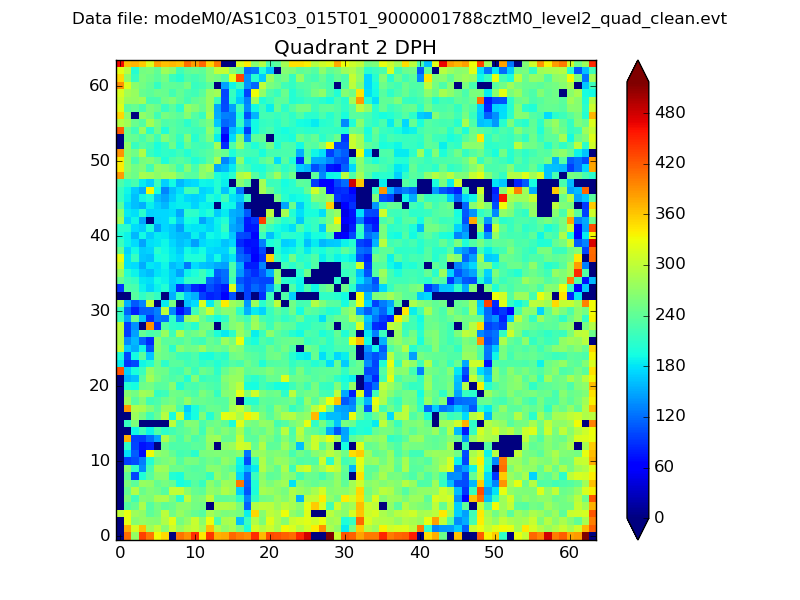 |
Quadrant C |
| Plot type | Count rate plots | Images |
|---|---|---|
| Comparison with Poisson distribution Blue bars denote a histogram of data divided into 1 sec bins. Red curve is a Poisson curve with rate = median count rate of data. |
 |
 |
| Quadrant-wise count rates Data is divided into 100 sec bins |
 |
|
| Module-wise count rates for Quadrant A Data is divided into 100 sec bins |
 |
 |
| Module-wise count rates for Quadrant B Data is divided into 100 sec bins |
 |
 |
| Module-wise count rates for Quadrant C Data is divided into 100 sec bins |
 |
 |
| Module-wise count rates for Quadrant D Data is divided into 100 sec bins |
 |
 |
| Parameter | Plot |
|---|---|
| CZT HV Monitor |  |
| D_VDD |  |
| Temperature 1 |  |
| Veto HV Monitor |  |
| Veto LLD |  |
| Alpha Counter |  |
| _CPM_Rate |  |
| CZT Counter |  |
| +2.5 Volts monitor |  |
| +5 Volts monitor |  |
| _ROLL_ROT |  |
| _Roll_DEC | 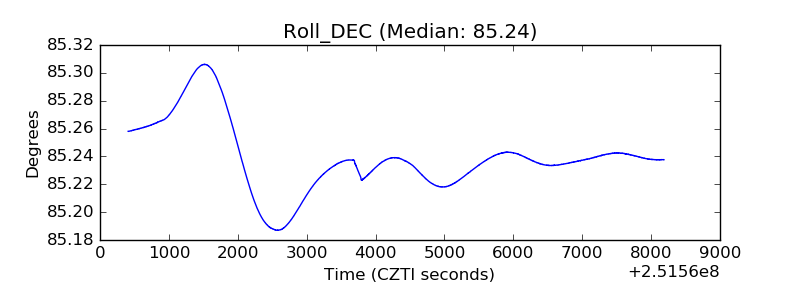 |
| _Roll_RA |  |
| Veto Counter |  |